
Page 174 - Read Online
P. 174
Ansari et al. J Cancer Metastasis Treat 2019;5:20 I http://dx.doi.org/10.20517/2394-4722.2018.68 Page 5 of 14
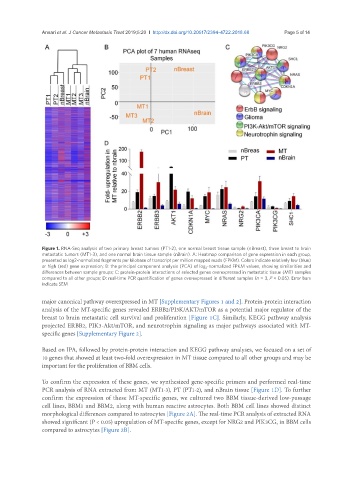
Figure 1. RNA-Seq analysis of two primary breast tumors (PT1-2), one normal breast tissue sample (nBreast), three breast to brain
metastatic tumors (MT1-3), and one normal brain tissue sample (nBrain). A: Heatmap comparison of gene expression in each group,
presented as log2-normalized fragments per kilobase of transcript per million mapped reads (FPKM). Colors indicate relatively low (blue)
or high (red) gene expression; B: the principal component analysis (PCA) of log 2 -normalized FPKM values, showing similarities and
differences between sample groups; C: protein-protein interactions of selected genes overexpressed in metastatic tissue (MT) samples
compared to all other groups; D: real-time PCR quantification of genes overexpressed in different samples (n = 3, P < 0.05). Error bars
indicate SEM
major canonical pathway overexpressed in MT [Supplementary Figures 1 and 2]. Protein-protein interaction
analysis of the MT-specific genes revealed ERBB2/PI3K/AKT/mTOR as a potential major regulator of the
breast to brain metastatic cell survival and proliferation [Figure 1C]. Similarly, KEGG pathway analysis
projected ERBB2, PIK3-Akt/mTOR, and neurotrophin signaling as major pathways associated with MT-
specific genes [Supplementary Figure 2].
Based on IPA, followed by protein-protein interaction and KEGG pathway analyses, we focused on a set of
10 genes that showed at least two-fold overexpression in MT tissue compared to all other groups and may be
important for the proliferation of BBM cells.
To confirm the expression of these genes, we synthesized gene-specific primers and performed real-time
PCR analysis of RNA extracted from MT (MT1-3), PT (PT1-2), and nBrain tissue [Figure 1D]. To further
confirm the expression of these MT-specific genes, we cultured two BBM tissue-derived low-passage
cell lines, BBM1 and BBM2, along with human reactive astrocytes. Both BBM cell lines showed distinct
morphological differences compared to astrocytes [Figure 2A]. The real-time PCR analysis of extracted RNA
showed significant (P < 0.05) upregulation of MT-specific genes, except for NRG2 and PIK3CG, in BBM cells
compared to astrocytes [Figure 2B].