
Page 176 - Read Online
P. 176
Ansari et al. J Cancer Metastasis Treat 2019;5:20 I http://dx.doi.org/10.20517/2394-4722.2018.68 Page 7 of 14
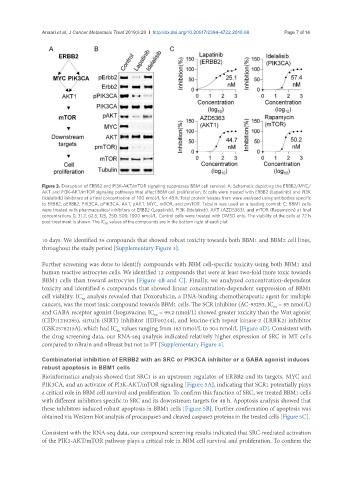
Figure 3. Disruption of ERBB2 and PI3K-AKT/mTOR signaling suppresses BBM cell survival. A: Schematic depicting the ERBB2/MYC/
AKT and PI3K-AKT/mTOR signaling pathways that affect BBM cell proliferation; B: cells were treated with ERBB2 (Lapatinib) and PI3K
(Idelalisib) inhibitors at a final concentration of 100 nmol/L for 48 h. Total protein lysates from were analyzed using antibodies specific
to ERBB2, pERBB2, PIK3CA, pPIK3CA, AKT, pAKT, MYC, mTOR, and pmTOR. Tubulin was used as a loading control; C: BBM1 cells
were treated with pharmaceutical inhibitors of ERBB2 (Lapatinib), PI3K (Idelalisib), AKT (AZD5363), and mTOR (Rapamycin) at final
concentrations 0, 31.2, 62.5, 125, 250, 500, 1000 nmol/L. Control cells were treated with DMSO only. The viability of the cells at 72 h
post-treatment is shown. The IC 50 values of the compounds are in the bottom right of each plot
10 days. We identified 35 compounds that showed robust toxicity towards both BBM1 and BBM2 cell lines,
throughout the study period [Supplementary Figure 3].
Further screening was done to identify compounds with BBM cell-specific toxicity using both BBM1 and
human reactive astrocytes cells. We identified 12 compounds that were at least two-fold more toxic towards
BBM1 cells than toward astrocytes [Figure 4B and C]. Finally, we analyzed concentration-dependent
toxicity and identified 6 compounds that showed linear concentration-dependent suppression of BBM1
cell viability. IC analysis revealed that Doxorubicin, a DNA-binding chemotherapeutic agent for multiple
50
cancers, was the most toxic compound towards BBM1 cells. The SCR inhibitor (AC-93253; IC = 85 nmol/L)
50
and GABA receptor agonist (Isoguvacine; IC = 99.2 nmol/L) showed greater toxicity than the Wnt agonist
50
(CID11210285), sirtuin (SIRT) inhibitor (JDF00244), and leucine-rich repeat kinase-2 (LRRK2) inhibitor
(GSK2578215A), which had IC values ranging from 183 nmol/L to 304 nmol/L [Figure 4D]. Consistent with
50
the drug screening data, our RNA-seq analysis indicated relatively higher expression of SRC in MT cells
compared to nBrain and nBreast but not to PT [Supplementary Figure 4].
Combinatorial inhibition of ERBB2 with an SRC or PIK3CA inhibitor or a GABA agonist induces
robust apoptosis in BBM1 cells
Bioinformatics analysis showed that SRC1 is an upstream regulator of ERBB2 and its targets, MYC and
PIK3CA, and an activator of PI3K-AKT/mTOR signaling [Figure 5A], indicating that SCR1 potentially plays
a critical role in BBM cell survival and proliferation. To confirm this function of SRC, we treated BBM1 cells
with different inhibitors specific to SRC and its downstream targets for 48 h. Apoptosis analysis showed that
these inhibitors induced robust apoptosis in BBM1 cells [Figure 5B]. Further confirmation of apoptosis was
obtained via Western blot analysis of procaspase3 and cleaved caspase3 proteins in the treated cells [Figure 5C].
Consistent with the RNA-seq data, our compound screening results indicated that SRC-mediated activation
of the PIK3-AKT/mTOR pathway plays a critical role in BBM cell survival and proliferation. To confirm the