
Page 175 - Read Online
P. 175
Page 6 of 14 Ansari et al. J Cancer Metastasis Treat 2019;5:20 I http://dx.doi.org/10.20517/2394-4722.2018.68
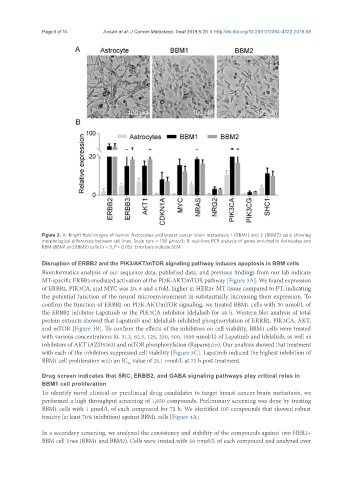
Figure 2. A: Bright field images of human Astrocytes and breast cancer brain metastasis 1 (BBM1) and 2 (BBM2) cells showing
morphological differences between cell lines. Scale bars = 100 μmol/L; B: real-time PCR analysis of genes enriched in Astrocytes and
BBM (BBM1 and BBM2) cells (n = 3, P < 0.05). Error bars indicate SEM
Disruption of ERBB2 and the PIK3/AKT/mTOR signaling pathway induces apoptosis in BBM cells
Bioinformatics analysis of our sequence data, published data, and previous findings from our lab indicate
MT-specific ERBB2-mediated activation of the PI3K-AKT/mTOR pathway [Figure 3A]. We found expression
of ERBB2, PIK3CA, and MYC was 20, 8 and 4 fold, higher in HER2+ MT tissue compared to PT, indicating
the potential function of the neural microenvironment in substantially increasing their expression. To
confirm the function of ERBB2 on PI3K-AKT/mTOR signaling, we treated BBM1 cells with 50 nmol/L of
the ERBB2 inhibitor Lapatinib or the PIK3CA inhibitor Idelalisib for 48 h. Western blot analysis of total
protein extracts showed that Lapatinib and Idelalisib inhibited phosphorylation of ERRB2, PIK3CA, AKT,
and mTOR [Figure 3B]. To confirm the effects of the inhibitors on cell viability, BBM1 cells were treated
with various concentrations (0, 31.2, 62.5, 125, 250, 500, 1000 nmol/L) of Lapatinib and Idelalisib, as well as
inhibitors of AKT (AZD5363) and mTOR phosphorylation (Rapamycin). Our analysis showed that treatment
with each of the inhibitors suppressed cell viability [Figure 3C]. Lapatinib induced the highest inhibition of
BBM1 cell proliferation with an IC value of 25.1 nmol/L at 72 h post-treatment.
50
Drug screen indicates that SRC, ERBB2, and GABA signaling pathways play critical roles in
BBM1 cell proliferation
To identify novel clinical or preclinical drug candidates to target breast cancer brain metastasis, we
performed a high throughput screening of 1,650 compounds. Preliminary screening was done by treating
BBM1 cells with 1 µmol/L of each compound for 72 h. We identified 105 compounds that showed robust
toxicity (at least 70% inhibition) against BBM1 cells [Figure 4A].
In a secondary screening, we analyzed the consistency and stability of the compounds against two HER2+
BBM cell lines (BBM1 and BBM2). Cells were treated with 50 nmol/L of each compound and analyzed over