
Page 11 - Read Online
P. 11
Calais da Silva et al. Systemic humoral responses during BCG treatment
from 0.13‰ to 0.23‰ (P = 0.0004). In addition, other
6W GNLY 0.22 0.70 0.26 0.42 0.85 0.44 0.53 0.53 0.70 0.53 0.84 0.44 significant changes were observed at week 6 of the
treatment, such as decreased GNLY (159.2‰ to
111.9‰, P = 0.008) and Perf (49.74‰ to 43.26‰, P =
1
0.01) [Figure 2].
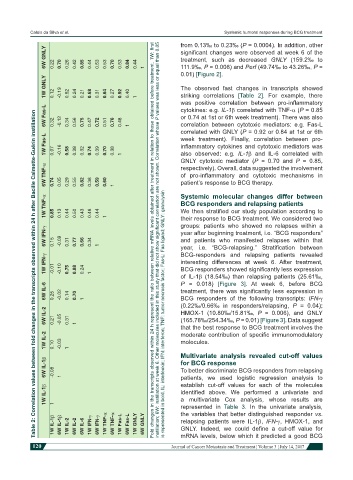
1W GNLY 0.12 -0.19 0.52 0.24 0.21 0.68 0.31 0.64 0.27 0.92 0.40 The observed fast changes in transcripts showed
striking correlations [Table 2]. For example, there
1
was positive correlation between pro-inflammatory
6W Fas-L 0.32 -0.12 0.34 0.56 0.75 0.47 0.72 0.51 0.76 0.48 cytokines: e.g. IL-1β correlated with TNF-α (Ρ = 0.85
Table 2: Correlation values between fold changes in the transcripts observed within 24 h after Bacille Calmette-Guérin instillation
or 0.74 at 1st or 6th week treatment). There was also
correlation between cytotoxic mediators: e.g. Fas-L
1
correlated with GNLY (Ρ = 0.92 or 0.84 at 1st or 6th
1W Fas-L 0.07 -0.16 0.58 0.38 0.32 0.74 0.39 0.70 0.38 week treatment). Finally, correlation between pro-
inflammatory cytokines and cytotoxic mediators was
also observed: e.g. IL-1β and IL-6 correlated with
1
GNLY cytotoxic mediator (Ρ = 0.70 and Ρ = 0.85,
6W TNF-α 0.74 0.05 0.29 0.55 0.82 0.38 0.59 0.60 1 of pro-inflammatory and cytotoxic mechanisms in
respectively). Overall, data suggested the involvement
patient’s response to BCG therapy.
1W TNF-α 0.85 0.13 0.44 0.50 0.43 0.46 0.44 Systemic molecular changes differ between
BCG responders and relapsing patients
We then stratified our study population according to
their response to BCG treatment. We considered two
1
groups: patients who showed no relapses within a
6W IFN-γ 0.15 -0.09 0.31 0.77 0.66 0.34 1 Fold changes in the transcripts observed within 24 h represent the ratio between relative mRNA levels obtained after treatment in relation to those obtained before treatment. 1W: first instillation; 6W: instillation at week 6. Other molecules included in this study that did not show significant correlation are not shown. Correlation whose P values was less or equal than 0.05 year after beginning treatment
and patients who manifested relapses within that
year, i.e. “BCG-relapsing.” Stratification between
1W IFN-γ -0.01 -0.10 0.75 0.88 0.24 BCG-responders and relapsing patients revealed
interesting differences at week 6. After treatment,
BCG responders showed significantly less expression
1
of IL-1β (18.54‰) than relapsing patients (25.61‰,
P = 0.018) [Figure 3]. At week 6, before BCG
6W IL-6 0.25 -0.02 0.14 0.70 treatment, there was significantly less expression in
BCG responders of the following transcripts: IFN-γ
1
(0.22‰/0.66‰ in responders/relapsing, P = 0.04);
6W IL-2 0.21 -0.05 0.31 is represented in bold. IL: interleukin; IFN: interferon; TNF: tumor necrosis factor; Fas-L: Fas ligand; GNLY: granulysin HMOX-1 (10.80‰/15.81‰, P = 0.006), and GNLY
(165.78‰/254.34‰, P = 0.01) [Figure 3]. Data suggest
1
that the best response to BCG treatment involves the
1W IL-2 0.10 -0.03 1 moderate contribution of specific immunomodulatory
molecules.
Multivariate analysis revealed cut-off values
6W IL-1β -0.08 for BCG response
To better discriminate BCG responders from relapsing
patients, we used logistic regression analysis to
1
establish cut-off values for each of the molecules
1W IL-1β identified above. We performed a univariate and
a multivariate Cox analysis, whose results are
1
represented in Table 3. In the univariate analysis,
the variables that better distinguished responder vs.
1W IL-1β 6W IL-1β 1W IL-2 6W IL-2 6W IL-6 1W IFN-γ 6W IFN-γ 1W TNF-α 6W TNF-α 1W Fas-L 6W Fas-L 1W GNLY 6W GNLY relapsing patients were IL-1β, IFN-γ, HMOX-1, and
GNLY. Indeed, we could define a cut-off value for
mRNA levels, below which it predicted a good BCG
120 Journal of Cancer Metastasis and Treatment ¦ Volume 3 ¦ July 14, 2017