
Page 54 - Read Online
P. 54
Page 247 Su et al. Intell Robot 2022;2(3):24474 I http://dx.doi.org/10.20517/ir.2022.17
education level education level
Z Z
do(S=s)
S Y s Y
religious belief hiring decision religious belief hiring decision
(a) (b)
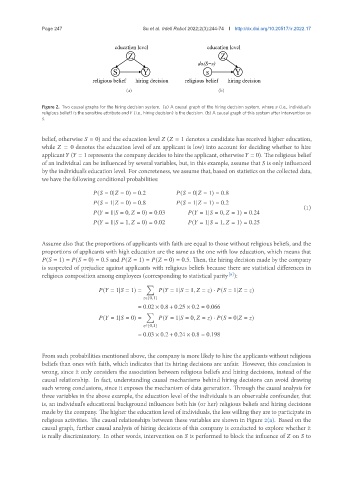
Figure 2. Two causal graphs for the hiring decision system. (a) A causal graph of the hiring decision system, where (i.e., individual’s
religious belief) is the sensitive attribute and (i.e., hiring decision) is the decision. (b) A causal graph of this system after intervention on
.
belief, otherwise = 0) and the education level ( = 1 denotes a candidate has received higher education,
while = 0 denotes the education level of am applicant is low) into account for deciding whether to hire
applicant ( = 1 represents the company decides to hire the applicant, otherwise = 0). The religious belief
of an individual can be influenced by several variables, but, in this example, assume that is only influenced
by the individual’s education level. For concreteness, we assume that, based on statistics on the collected data,
we have the following conditional probabilities:
( = 0| = 0) = 0.2 ( = 0| = 1) = 0.8
( = 1| = 0) = 0.8 ( = 1| = 1) = 0.2
(1)
( = 1| = 0, = 0) = 0.03 ( = 1| = 0, = 1) = 0.24
( = 1| = 1, = 0) = 0.02 ( = 1| = 1, = 1) = 0.25
Assume also that the proportions of applicants with faith are equal to those without religious beliefs, and the
proportions of applicants with high education are the same as the one with low education, which means that
( = 1) = ( = 0) = 0.5 and ( = 1) = ( = 0) = 0.5. Then, the hiring decision made by the company
is suspected of prejudice against applicants with religious beliefs because there are statistical differences in
[8]
religious composition among employees (corresponding to statistical parity ):
∑
( = 1| = 1) = ( = 1| = 1, = ) · ( = 1| = )
∈{0,1}
= 0.02 × 0.8 + 0.25 × 0.2 = 0.066
∑
( = 1| = 0) = ( = 1| = 0, = ) · ( = 0| = )
∈{0,1}
= 0.03 × 0.2 + 0.24 × 0.8 = 0.198
From such probabilities mentioned above, the company is more likely to hire the applicants without religious
beliefs than ones with faith, which indicates that its hiring decisions are unfair. However, this conclusion is
wrong, since it only considers the association between religious beliefs and hiring decisions, instead of the
causal relationship. In fact, understanding causal mechanisms behind hiring decisions can avoid drawing
such wrong conclusions, since it exposes the mechanism of data generation. Through the causal analysis for
three variables in the above example, the education level of the individuals is an observable confounder, that
is, an individual’s educational background influences both his (or her) religious beliefs and hiring decisions
made by the company. The higher the education level of individuals, the less willing they are to participate in
religious activities. The causal relationships between these variables are shown in Figure 2(a). Based on the
causal graph, further causal analysis of hiring decisions of this company is conducted to explore whether it
is really discriminatory. In other words, intervention on is performed to block the influence of on to