
Page 54 - Read Online
P. 54
Wang et al. Intell Robot 2023;3(4):538-64 I http://dx.doi.org/10.20517/ir.2023.30 Page 21 of 27
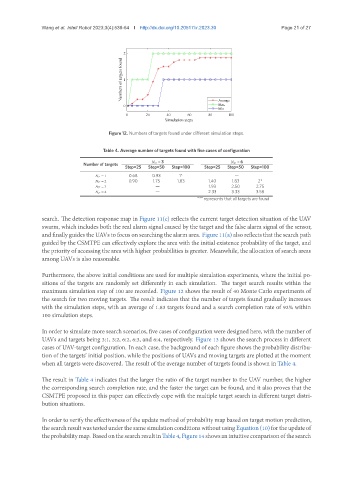
Figure 12. Numbers of targets found under different simulation steps.
Table 4. Average number of targets found with five cases of configuration
= 3 = 6
Number of targets
Step=25 Step=50 Step=100 Step=25 Step=50 Step=100
= 1 0.68 0.93 1* —
= 2 0.90 1.75 1.83 1.40 1.83 2*
= 3 — 1.93 2.50 2.75
= 4 — 2.33 3.33 3.58
”*” represents that all targets are found
search. The detection response map in Figure 11(c) reflects the current target detection situation of the UAV
swarm, which includes both the real alarm signal caused by the target and the false alarm signal of the sensor,
and finally guides the UAVs to focus on searching the alarm area. Figure 11(a) also reflects that the search path
guided by the CSMTPE can effectively explore the area with the initial existence probability of the target, and
the priority of accessing the area with higher probabilities is greater. Meanwhile, the allocation of search areas
among UAVs is also reasonable.
Furthermore, the above initial conditions are used for multiple simulation experiments, where the initial po-
sitions of the targets are randomly set differently in each simulation. The target search results within the
maximum simulation step of 100 are recorded. Figure 12 shows the result of 40 Monte Carlo experiments of
the search for two moving targets. The result indicates that the number of targets found gradually increases
with the simulation steps, with an average of 1.83 targets found and a search completion rate of 92% within
100 simulation steps.
In order to simulate more search scenarios, five cases of configuration were designed here, with the number of
UAVs and targets being 3:1, 3:2, 6:2, 6:3, and 6:4, respectively. Figure 13 shows the search process in different
cases of UAV-target configuration. In each case, the background of each figure shows the probability distribu-
tion of the targets’ initial position, while the positions of UAVs and moving targets are plotted at the moment
when all targets were discovered. The result of the average number of targets found is shown in Table 4.
The result in Table 4 indicates that the larger the ratio of the target number to the UAV number, the higher
the corresponding search completion rate, and the faster the target can be found, and it also proves that the
CSMTPE proposed in this paper can effectively cope with the multiple target search in different target distri-
bution situations.
In order to verify the effectiveness of the update method of probability map based on target motion prediction,
thesearchresultwastestedunderthesamesimulationconditionswithoutusingEquation(10)fortheupdateof
theprobabilitymap. BasedonthesearchresultinTable4,Figure14showsanintuitivecomparisonofthesearch