
Page 23 - Read Online
P. 23
Page 348 Zhang et al. Intell. Robot. 2025, 5(2), 333-54 I http://dx.doi.org/10.20517/ir.2025.17
(a) 1 (b) 2 (c) 3
(d) 4 (e) 5
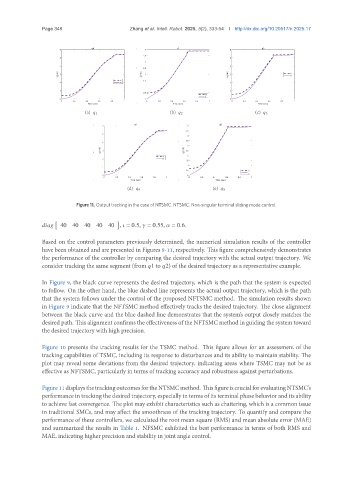
Figure 11. Output tracking in the case of NTSMC. NTSMC: Non-singular terminal sliding mode control.
40 40 40 40 40 , = 0.5, = 0.55, = 0.6.
Based on the control parameters previously determined, the numerical simulation results of the controller
have been obtained and are presented in Figures 9-11, respectively. This figure comprehensively demonstrates
the performance of the controller by comparing the desired trajectory with the actual output trajectory. We
consider tracking the same segment (from 1 to 2) of the desired trajectory as a representative example.
In Figure 9, the black curve represents the desired trajectory, which is the path that the system is expected
to follow. On the other hand, the blue dashed line represents the actual output trajectory, which is the path
that the system follows under the control of the proposed NFTSMC method. The simulation results shown
in Figure 9 indicate that the NFTSMC method effectively tracks the desired trajectory. The close alignment
between the black curve and the blue dashed line demonstrates that the system’s output closely matches the
desired path. This alignment confirms the effectiveness of the NFTSMC method in guiding the system toward
the desired trajectory with high precision.
Figure 10 presents the tracking results for the TSMC method. This figure allows for an assessment of the
tracking capabilities of TSMC, including its response to disturbances and its ability to maintain stability. The
plot may reveal some deviations from the desired trajectory, indicating areas where TSMC may not be as
effective as NFTSMC, particularly in terms of tracking accuracy and robustness against perturbations.
Figure11displaysthetrackingoutcomesfortheNTSMCmethod. ThisfigureiscrucialforevaluatingNTSMC’s
performance in tracking the desired trajectory, especially in terms of its terminal phase behavior and its ability
to achieve fast convergence. The plot may exhibit characteristics such as chattering, which is a common issue
in traditional SMCs, and may affect the smoothness of the tracking trajectory. To quantify and compare the
performance of these controllers, we calculated the root mean square (RMS) and mean absolute error (MAE)
and summarized the results in Table 1. NFSMC exhibited the best performance in terms of both RMS and
MAE, indicating higher precision and stability in joint angle control.