
Page 162 - Read Online
P. 162
Page 12 of 19 Ao et al. Intell Robot 2023;3(4):495-513 I http://dx.doi.org/10.20517/ir.2023.28
This matrix contains the scores for that round for different gesture recognition tasks. Use these scores as the
base scores for each gesture. After the combination cases and base scores are calculated for all rounds, the
contribution of each channel is obtained using the Shapley value formula. In this section, we first verify that
the synergy between different muscles is able to influence the network through a single-channel test. We
took the minimum value of the prediction matrix parameters for the whole process as the base value of the
membership score, representing the fraction of the contribution that the network considers for that part. We
then focused on testing channel electrodes 4, 6, 7, and 8 to explore the synergy between the forearm muscle
groups corresponding to these four electrodes and also tested the synergy between the upper-limb flexors and
upper-limb extensors corresponding to channel electrodes 9 and 10 in 12 gestures. Finally, we took the inputs
of the 4, 6, 7, and 8 electrode channels as one coalition member and the inputs of the 9 and 10 electrode
channels as another coalition member and then explored the interactions between these two muscle groups
and obtained some results.
3.4.1 Contribution of the input channel
We use the member division in the SVMS method, with ten acquisition channels viewed as ten participants.
A picture of gesture 1 is selected from the test set, and we mask columns 2-10 (setting columns 2 to 10 of the
picture matrix to 0) and then feed the picture into the network to obtain the prediction matrix. We extract only
the value of gesture 1 from the prediction matrix of this image, which is -78.74, as shown in the table below,
then mask the first column and columns 3-10, and then feed the image into the network, which is equivalent
to using only channel 2 to obtain the result. Again, only the value of -38.11 is taken from the prediction matrix
for gesture 1. Repeating the above steps until the ten channels are executed individually as inputs, we get the
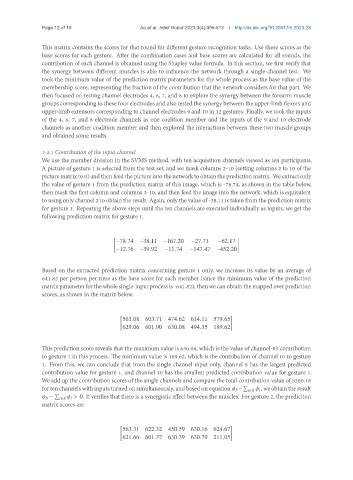
following prediction matrix for gesture 1.
[ ]
−78.74 −38.11 −167.20 −27.71 −62.17
−12.76 −39.92 −11.74 −147.47 −452.20
Based on the extracted prediction matrix concerning gesture 1 only, we increase its value by an average of
641.82 per person per time as the base score for each member (since the minimum value of the prediction
matrixparameterforthewholesingle-inputprocessis-641.82),thenwecanobtainthemappedoverprediction
scores, as shown in the matrix below.
[ ]
563.08 603.71 474.62 614.11 579.65
629.06 601.90 630.08 494.35 189.62
This prediction score reveals that the maximum value is 630.08, which is the value of channel-8’s contribution
to gesture 1 in this process. The minimum value is 189.62, which is the contribution of channel 10 to gesture
1. From this, we can conclude that from the single channel input only, channel 8 has the largest predicted
contribution value for gesture 1, and channel 10 has the smallest predicted contribution value for gesture 1.
We add up the contribution scores of the single channels and compare the total contribution value of 5380.18
∑
for ten channels with inputs turned on simultaneously, and based on equation − ∈ , we obtain the result
∑
− ∈ > 0. It verifies that there is a synergistic effect between the muscles. For gesture 2, the prediction
matrix scores are
[ ]
563.31 622.32 450.59 630.16 624.67
621.66 601.37 630.39 630.79 211.05