
Page 159 - Read Online
P. 159
Ao et al. Intell Robot 2023;3(4):495-513 I http://dx.doi.org/10.20517/ir.2023.28 Page 9 of 19
Table 1. Number of color images of sEMG signals for twelve gestures
Gesture a b c d e f
Number of pictures 15268 15016 17451 13726 13756 14599
Gesture g h i j k l
Number of pictures 14818 15568 13894 13189 12468 14576
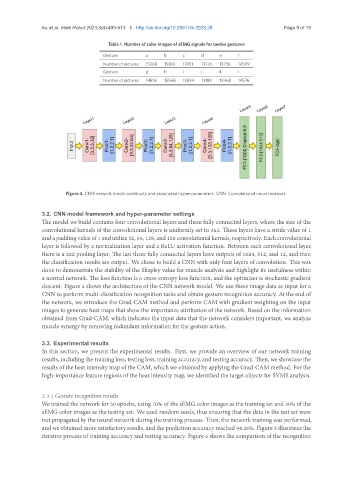
Figure 4. CNN network model constructs and associated hyper-parameters. CNN: Convolutional neural network.
3.2. CNN model framework and hyper-parameter settings
The model we build contains four convolutional layers and three fully connected layers, where the size of the
convolutional kernels of the convolutional layers is uniformly set to 3x3. These layers have a stride value of 1
andapaddingvalueof1andutilize32, 64, 128, and128convolutionalkernels, respectively. Eachconvolutional
layer is followed by a normalization layer and a ReLU activation function. Between each convolutional layer,
there is a 2x2 pooling layer. The last three fully connected layers have outputs of 1024, 512, and 12, and then
the classification results are output. We chose to build a CNN with only four layers of convolution. This was
done to demonstrate the stability of the Shapley value for muscle analysis and highlight its usefulness within
a normal network. The loss function is a cross-entropy loss function, and the optimizer is stochastic gradient
descent. Figure 4 shows the architecture of the CNN network model. We use these image data as input for a
CNN to perform multi-classification recognition tasks and obtain gesture recognition accuracy. At the end of
the network, we introduce the Grad-CAM method and perform CAM with gradient weighting on the input
images to generate heat maps that show the importance attribution of the network. Based on the information
obtained from Grad-CAM, which indicates the input data that the network considers important, we analyze
muscle synergy by removing redundant information for the gesture action.
3.3. Experimental results
In this section, we present the experimental results. First, we provide an overview of our network training
results, including the training loss, testing loss, training accuracy, and testing accuracy. Then, we showcase the
results of the heat intensity map of the CAM, which we obtained by applying the Grad-CAM method. For the
high-importance feature regions of the heat intensity map, we identified the target objects for SVMS analysis.
3.3.1 Gesture recognition results
We trained the network for 50 epochs, using 70% of the sEMG color images as the training set and 30% of the
sEMG color images as the testing set. We used random seeds, thus ensuring that the data in the test set were
not propagated by the neural network during the training process. Then, the network training was performed,
and we obtained more satisfactory results, and the prediction accuracy reached 94.26%. Figure 5 illustrates the
iterative process of training accuracy and testing accuracy. Figure 6 shows the comparison of the recognition