
Page 154 - Read Online
P. 154
Page 4 of 19 Ao et al. Intell Robot 2023;3(4):495-513 I http://dx.doi.org/10.20517/ir.2023.28
Figure 1. The framework of the Shapley-value-based muscle synergy (SVMS) method.
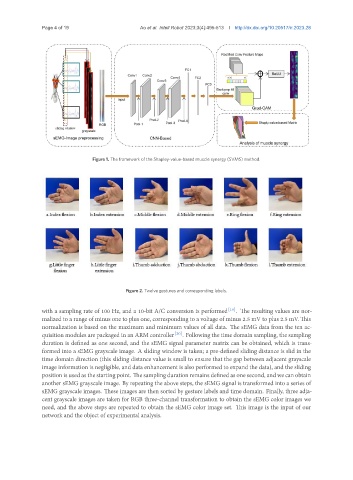
Figure 2. Twelve gestures and corresponding labels.
with a sampling rate of 100 Hz, and a 10-bit A/C conversion is performed [19] . The resulting values are nor-
malized to a range of minus one to plus one, corresponding to a voltage of minus 2.5 mV to plus 2.5 mV. This
normalization is based on the maximum and minimum values of all data. The sEMG data from the ten ac-
quisition modules are packaged in an ARM controller [20] . Following the time domain sampling, the sampling
duration is defined as one second, and the sEMG signal parameter matrix can be obtained, which is trans-
formed into a sEMG grayscale image. A sliding window is taken; a pre-defined sliding distance is slid in the
time domain direction (this sliding distance value is small to ensure that the gap between adjacent grayscale
image information is negligible, and data enhancement is also performed to expand the data), and the sliding
position is used as the starting point. The sampling duration remains defined as one second, and we can obtain
another sEMG grayscale image. By repeating the above steps, the sEMG signal is transformed into a series of
sEMG grayscale images. These images are then sorted by gesture labels and time domain. Finally, three adja-
cent grayscale images are taken for RGB three-channel transformation to obtain the sEMG color images we
need, and the above steps are repeated to obtain the sEMG color image set. This image is the input of our
network and the object of experimental analysis.