
Page 158 - Read Online
P. 158
Page 8 of 19 Ao et al. Intell Robot 2023;3(4):495-513 I http://dx.doi.org/10.20517/ir.2023.28
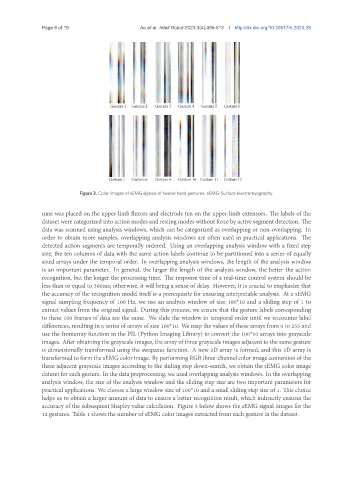
Figure 3. Color images of sEMG signals of twelve hand gestures. sEMG: Surface electromyography.
nine was placed on the upper-limb flexors and electrode ten on the upper-limb extensors. The labels of the
dataset were categorized into action modes and resting modes without force by active segment detection. The
data was scanned using analysis windows, which can be categorized as overlapping or non-overlapping. In
order to obtain more samples, overlapping analysis windows are often used in practical applications. The
detected action segments are temporally ordered. Using an overlapping analysis window with a fixed step
size, the ten columns of data with the same action labels continue to be partitioned into a series of equally
sized arrays under the temporal order. In overlapping analysis windows, the length of the analysis window
is an important parameter. In general, the larger the length of the analysis window, the better the action
recognition, but the longer the processing time. The response time of a real-time control system should be
less than or equal to 300ms; otherwise, it will bring a sense of delay. However, it is crucial to emphasize that
the accuracy of the recognition model itself is a prerequisite for ensuring interpretable analysis. At a sEMG
signal sampling frequency of 100 Hz, we use an analysis window of size 100*10 and a sliding step of 1 to
extract values from the original signal. During this process, we ensure that the gesture labels corresponding
to these 100 frames of data are the same. We slide the window in temporal order until we encounter label
differences, resulting in a series of arrays of size 100*10. We map the values of these arrays from 0 to 255 and
use the fromarray function in the PIL (Python Imaging Library) to convert the 100*10 arrays into grayscale
images. After obtaining the grayscale images, the array of three grayscale images adjacent to the same gesture
is dimensionally transformed using the swapaxes function. A new 3D array is formed, and this 3D array is
transformed to form the sEMG color image. By performing RGB three-channel color image conversion of the
three adjacent grayscale images according to the sliding step down-search, we obtain the sEMG color image
dataset for each gesture. In the data preprocessing, we used overlapping analysis windows. In the overlapping
analysis window, the size of the analysis window and the sliding step size are two important parameters for
practical applications. We choose a large window size of 100*10 and a small sliding step size of 1. This choice
helps us to obtain a larger amount of data to ensure a better recognition result, which indirectly ensures the
accuracy of the subsequent Shapley value calculation. Figure 3 below shows the sEMG signal images for the
12 gestures. Table 1 shows the number of sEMG color images extracted from each gesture in the dataset.