
Page 238 - Read Online
P. 238
Block et al. Hepatoma Res 2019;5:21 I http://dx.doi.org/10.20517/2394-5079.2019.17 Page 5 of 8
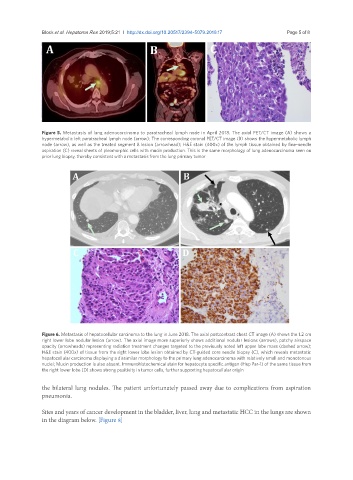
Figure 5. Metastasis of lung adenocarcinoma to paratracheal lymph node in April 2018. The axial PET/CT image (A) shows a
hypermetabolic left paratracheal lymph node (arrow); The corresponding coronal PET/CT image (B) shows the hypermetabolic lymph
node (arrow), as well as the treated segment 8 lesion (arrowhead); H&E stain (400x) of the lymph tissue obtained by fine-needle
aspiration (C) reveal sheets of pleomorphic cells with mucin production. This is the same morphology of lung adenocarcinoma seen on
prior lung biopsy, thereby consistent with a metastasis from the lung primary tumor
Figure 6. Metastasis of hepatocellular carcinoma to the lung in June 2018. The axial postcontrast chest CT image (A) shows the 1.2 cm
right lower lobe nodular lesion (arrow). The axial image more superiorly shows additional nodular lesions (arrows), patchy airspace
opacity (arrowheads) representing radiation treatment changes targeted to the previously noted left upper lobe mass (dashed arrow);
H&E stain (400x) of tissue from the right lower lobe lesion obtained by CT-guided core needle biopsy (C), which reveals metastatic
hepatocellular carcinoma displaying a dissimilar morphology to the primary lung adenocarcinoma with relatively small and monotonous
nuclei; Mucin production is also absent. Immunohistochemical stain for hepatocyte specific antigen (Hep Par-1) of the same tissue from
the right lower lobe (D) shows strong positivity in tumor cells, further supporting hepatocellular origin
the bilateral lung nodules. The patient unfortunately passed away due to complications from aspiration
pneumonia.
Sites and years of cancer development in the bladder, liver, lung and metastatic HCC in the lungs are shown
in the diagram below. [Figure 8]