
Page 236 - Read Online
P. 236
Block et al. Hepatoma Res 2019;5:21 I http://dx.doi.org/10.20517/2394-5079.2019.17 Page 3 of 8
Figure 1. First diagnosis and treatment of hepatocellular carcinoma in 2004. The image from the celiac axis arteriogram in 2004
(A) shows a hyperenhancing lesion (arrow) corresponding to the hepatocellular carcinoma in segment 8; The axial T1-weighted fat-
suppressed precontrast image (B) following chemoembolization shows the lesion (arrow) which fails to enhance on the subsequent
postcontrast image (C); The longitudinal ultrasound image (D) shows the hypoechoic treated lesion (marked by calipers) with
intralesional echogenic foci, likely reflecting posttreatment changes
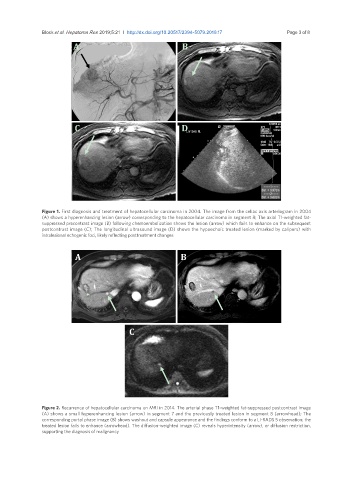
Figure 2. Recurrence of hepatocellular carcinoma on MRI in 2014. The arterial phase T1-weighted fat-suppressed postcontrast image
(A) shows a small hyperenhancing lesion (arrow) in segment 7 and the previously treated lesion in segment 8 (arrowhead); The
corresponding portal phase image (B) shows washout and capsule appearance and the findings conform to a LI-RADS 5 observation; the
treated lesion fails to enhance (arrowhead). The diffusion-weighted image (C) reveals hyperintensity (arrow), or diffusion restriction,
supporting the diagnosis of malignancy