Page 98 - Read Online
P. 98

Bhatia et al. Hepatoma Res 2018;4:9  I  http://dx.doi.org/10.20517/2394-5079.2018.04                                                Page 7 of 16

                     A  50             Control               B                 NDEA
                                                               50
                       45                                      45
                       40                                      40
                       35                                      35
                      Counts (%)  30                     Liver  Counts (%)  30
                       25
                                                               25
                       20
                                                               20
                       15                                      15                                Liver
                       10                                      10
                        5                                       5
                        0                                       0
                         0      5      10     15     20     25     30     35     40     45     50     55     60      65  0      5      10    15     20     25     30     35     40     45    50     55      60     65
                                                                     t (in minutes)                                             t (in minutes)
                                                              D               LycT + NDEA
                       C                                        60
                         50             LycT
                                                                50
                         40
                                                                40
                        Counts (%)  30                         Counts (%)  30                    Liver
                         20
                                                       Liver    20
                         10                                     10
                         0                                      0
                          0      5     10     15     20    25     30     35    40     45     50     55    60      65  0      5      10     15     20     25     30      35     40     45     50     55      60      65
                                                                    t (in minutes)                                              t (in minutes)
                                     E   120                                 Control

                                         100                                 NDEA
                                      Hepatic mebrofebnin   retention (% peak counts)  60  LycT
                                          80
                                                                             LycT + NDEA
                                          40
                                          20
                                          0
                                              PEAK            10              20              30               45               60
                                                                                   t (in minutes)

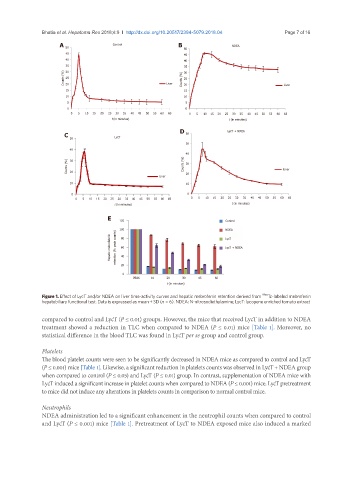
               Figure 1. Effect of LycT and/or NDEA on liver time-activity curves and hepatic mebrofenin retention derived from  99m Tc-labeled mebrofenin
               hepatobiliary functional test. Data is expressed as mean ± SD (n = 6). NDEA: N-nitrosodiethylamine; LycT: lycopene enriched tomato extract

               compared to control and LycT (P ≤ 0.01) groups. However, the mice that received LycT in addition to NDEA
               treatment showed a reduction in TLC when compared to NDEA (P ≤ 0.01) mice [Table 1]. Moreover, no
               statistical difference in the blood TLC was found in LycT per se group and control group.

               Platelets
               The blood platelet counts were seen to be significantly decreased in NDEA mice as compared to control and LycT
               (P ≤ 0.001) mice [Table 1]. Likewise, a significant reduction in platelets counts was observed in LycT + NDEA group
               when compared to control (P ≤ 0.05) and LycT (P ≤ 0.01) group. In contrast, supplementation of NDEA mice with
               LycT induced a significant increase in platelet counts when compared to NDEA (P ≤ 0.001) mice. LycT pretreatment
               to mice did not induce any alterations in platelets counts in comparison to normal control mice.


               Neutrophils
               NDEA administration led to a significant enhancement in the neutrophil counts when compared to control
               and LycT (P ≤ 0.001) mice [Table 1]. Pretreatment of LycT to NDEA exposed mice also induced a marked
   93   94   95   96   97   98   99   100   101   102   103