
Page 100 - Read Online
P. 100
Bhatia et al. Hepatoma Res 2018;4:9 I http://dx.doi.org/10.20517/2394-5079.2018.04 Page 9 of 16
A 45 B 3.0
40 a a,b,c 2.5 a
Serum TNF-a levels (pg/mL) 30 b Serum IL-6 levels (pg/mL) 2.0 b b
35
25
1.5
20
15
1.0
10
5 0.5
0 0.0
Control NDEA LycT LycT + NDEA Control NDEA LycT LycT + NDEA
Group Group
C 70 a
60 a,b,c
Serum IL-1b levels (pg/mL) 40 b
50
30
20
10
0
Control NDEA LycT LycT + NDEA
Group
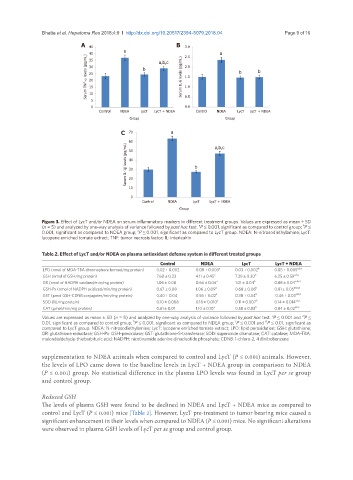
Figure 3. Effect of LycT and/or NDEA on serum inflammatory markers in different treatment groups. Values are expressed as mean ± SD
b
a
(n = 5) and analyzed by one-way analysis of variance followed by post hoc test. P ≤ 0.001, significant as compared to control group; P ≤
c
0.001, significant as compared to NDEA group; P ≤ 0.001, significant as compared to LycT group. NDEA: N-nitrosodiethylamine; LycT:
lycopene enriched tomato extract; TNF: tumor necrosis factor; IL: interleukin
Table 2. Effect of LycT and/or NDEA on plasma antioxidant defense system in different treated groups
Control NDEA LycT LycT + NDEA
LPO (nmol of MDA-TBA chromophore formed/mg protein) 0.02 ± 0.002 0.08 ± 0.003 a 0.03 ± 0.002 b 0.05 ± 0.005 a,b,c
GSH (nmol of GSH/mg protein) 7.60 ± 0.23 4.11 ± 0.45 a 7.29 ± 0.20 b 6.25 ± 0.59 a,b,c
GR (nmol of NADPH oxidized/min/mg protein) 1.06 ± 0.08 0.66 ± 0.06 a 1.01 ± 0.04 b 0.88 ± 0.04 a,b,c1
GSH-Px (nmol of NADPH oxidized/min/mg protein) 0.67 ± 0.08 1.06 ± 0.09 a 0.68 ± 0.06 b 0.81 ± 0.05 a1,b,c1
GST (μmol GSH-CDNB conjugates/min/mg protein) 0.40 ± 0.04 0.55 ± 0.02 a 0.38 ± 0.04 b 0.46 ± 0.03 a1,b,c
SOD (IU/mg protein) 0.10 ± 0.008 0.18 ± 0.010 a 0.11 ± 0.007 b 0.14 ± 0.014 a,b,c
CAT (µmol/min/mg protein) 0.61 ± 0.01 1.10 ± 0.10 a 0.58 ± 0.03 b 0.84 ± 0.02 a,b,c
Values are expressed as mean ± SD (n = 5) and analyzed by one-way analysis of variance followed by post hoc test. P ≤ 0.001 and P ≤
a
a1
b
c1
c
0.01, significant as compared to control group; P ≤ 0.001, significant as compared to NDEA group; P ≤ 0.001 and P ≤ 0.01, significant as
compared to LycT group. NDEA: N-nitrosodiethylamine; LycT: lycopene enriched tomato extract; LPO: lipid peroxidation; GSH: glutathione;
GR: glutathione reductase; GSH-Px: GSH-peroxidase; GST: glutathione-S-transferase; SOD: superoxide dismutase; CAT: catalase; MDA-TBA:
malondialdehyde-thiobarbituric acid; NADPH: nicotinamide adenine dinucleotide phosphate; CDNB: 1-chloro-2, 4 dinitrobenzene
supplementation to NDEA animals when compared to control and LycT (P ≤ 0.001) animals. However,
the levels of LPO came down to the baseline levels in LycT + NDEA group in comparison to NDEA
(P ≤ 0.001) group. No statistical difference in the plasma LPO levels was found in LycT per se group
and control group.
Reduced GSH
The levels of plasma GSH were found to be declined in NDEA and LycT + NDEA mice as compared to
control and LycT (P ≤ 0.001) mice [Table 2]. However, LycT pre-treatment to tumor bearing mice caused a
significant enhancement in their levels when compared to NDEA (P ≤ 0.001) mice. No significant alterations
were observed in plasma GSH levels of LycT per se group and control group.