
Page 298 - Read Online
P. 298
Tian et al. Hepatoma Res 2018;4:27 I http://dx.doi.org/10.20517/2394-5079.2018.24 Page 5 of 7
HCC survival
1.0 TT
TC
0.8 CC
Survival probability 0.6 Log-rank P = 0.039
0.4
0.2
0.0
0 10 20 30 40 50 60
Survival time (months)
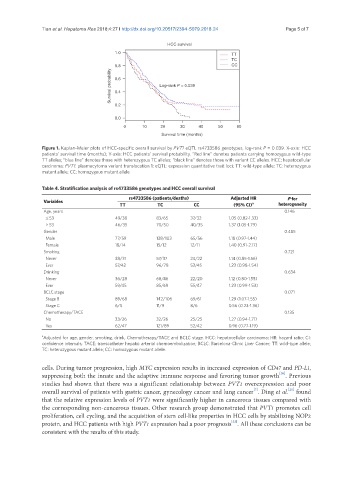
Figure 1. Kaplan-Meier plots of HCC-specific overall survival by PVT1 eQTL rs4733586 genotypes, log-rank P = 0.039. X-axis: HCC
patients’ survival time (months); Y-axis: HCC patients’ survival probability. “Red line” denotes patients carrying homozygous wild-type
TT alleles; “blue line” denotes those with heterozygous TC alleles; “black line” denotes those with variant CC alleles. HCC: hepatocellular
carcinoma; PVT1: plasmacytoma variant translocation 1; eQTL: expression quantitative trait loci; TT: wild-type allele; TC: heterozygous
mutant allele; CC: homozygous mutant allele
Table 4. Stratification analysis of rs4733586 genotypes and HCC overall survival
rs4733586 (patients/deaths) Adjusted HR P for
Variables a
TT TC CC (95% CI) heterogeneity
Age, years 0.146
≤ 53 49/38 83/65 37/32 1.05 (0.82-1.33)
> 53 46/35 70/50 40/35 1.37 (1.05-1.79)
Gender 0.485
Male 77/59 138/103 65/56 1.18 (0.97-1.44)
Female 18/14 15/12 12/11 1.40 (0.91-2.17)
Smoking 0.721
Never 38/31 57/37 24/22 1.14 (0.85-1.56)
Ever 57/42 96/78 53/45 1.23 (0.98-1.54)
Drinking 0.634
Never 36/28 68/46 22/20 1.12 (0.80-1.55)
Ever 59/45 85/69 55/47 1.23 (0.99-1.53)
BCLCstage 0.071
Stage B 89/68 142/106 69/61 1.29 (1.07-1.55)
Stage C 6/5 11/9 8/6 0.56 (0.23-1.36)
Chemotherapy/TACE 0.135
No 33/26 32/26 25/25 1.27 (0.94-1.71)
Yes 62/47 121/89 52/42 0.96 (0.77-1.19)
a Adjusted for age, gender, smoking, drink, Chemotherapy/TACE and BCLC stage. HCC: hepatocellular carcinoma; HR: hazard ratio; CI:
confidence intervals; TACE: transcatheter hepatic arterial chemoembolization; BCLC: Barcelona-Clinic Liver Cancer; TT: wild-type allele;
TC: heterozygous mutant allele; CC: homozygous mutant allele.
cells. During tumor progression, high MYC expression results in increased expression of CD47 and PD-L1,
[20]
suppressing both the innate and the adaptive immune response and favoring tumor growth . Previous
studies had shown that there was a significant relationship between PVT1 overexpression and poor
[21]
[7]
overall survival of patients with gastric cancer, gynecology cancer and lung cancer . Ding et al. found
that the relative expression levels of PVT1 were significantly higher in cancerous tissues compared with
the corresponding non-cancerous tissues. Other research group demonstrated that PVT1 promotes cell
proliferation, cell cycling, and the acquisition of stem cell-like properties in HCC cells by stabilizing NOP2
[22]
protein, and HCC patients with high PVT1 expression had a poor prognosis . All these conclusions can be
consistent with the results of this study.