
Page 297 - Read Online
P. 297
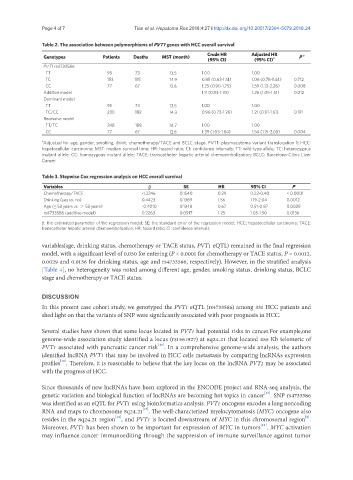
Page 4 of 7                                                      Tian et al. Hepatoma Res 2018;4:27 I http://dx.doi.org/10.20517/2394-5079.2018.24


               Table 2. The association between polymorphisms of PVT1 genes with HCC overall survival
                                                                       Crude HR       Adjusted HR      a
                Genotypes           Patients  Deaths    MST (month)                          a        P
                                                                       (95% CI)        (95% CI)
                PVT1 rs4733586
                  TT                 95        73         13.5       1.00             1.00
                  TC                 153       115        14.9       0.85 (0.63-1.14)  1.06 (0.78-1.44)  0.712
                  CC                 77        67         12.6       1.25 (0.90-1.75)  1.59 (1.13-2.26)  0.008
                Additive model                                       1.11 (0.93-1.33)  1.26 (1.05-1.51)  0.012
                Dominant model
                  TT                 95        73         13.5       1.00             1.00
                  TC/CC              230       182        14.3       0.96 (0.73-1.26)  1.21 (0.91-1.61)  0.191
                Recessive model
                  TT/TC              248       188        14.7       1.00             1.00
                  CC                 77        67         12.6       1.39 (1.05-1.84)  1.54 (1.15-2.05)  0.004
               a Adjusted for age, gender, smoking, drink, chemotherapy/TACE and BCLC stage. PVT1: plasmacytoma variant translocation 1; HCC:
               hepatocellular carcinoma; MST: median survival time; HR: hazard ratio; CI: confidence intervals; TT: wild-type allele; TC: heterozygous
               mutant allele; CC: homozygous mutant allele; TACE: transcatheter hepatic arterial chemoembolization; BCLC: Barcelona-Clinic Liver
               Cancer

               Table 3. Stepwise Cox regression analysis on HCC overall survival

                Variables                          b           SE          HR         95% CI       P
                Chemotherapy/TACE                -1.2246      0.1540      0.29       0.22-0.40    < 0.0001
                Drinking (yes vs. no)            0.4423       0.1369      1.56       1.19-2.04    0.0012
                Age (≤ 53 years vs. > 53 years)  -0.4010      0.1348      0.67       0.51-0.87    0.0029
                rs4733586 (additive model)       0.2263       0.0917      1.25       1.05-1.50    0.0136
               b: the estimated parameter of the regression model; SE: the standard error of the regression model; HCC: hepatocellular carcinoma; TACE:
               transcatheter hepatic arterial chemoembolization; HR: hazard ratio; CI: confidence intervals

               variables(age, drinking status, chemotherapy or TACE status, PVT1 eQTL) remained in the final regression
               model, with a significant level of 0.050 for entering (P < 0.0001 for chemotherapy or TACE status, P = 0.0012,
               0.0029 and 0.0136 for drinking status, age and rs4733586, respectively). However, in the stratified analysis
               [Table 4], no heterogeneity was noted among different age, gender, smoking status, drinking status, BCLC
               stage and chemotherapy or TACE status.


               DISCUSSION
               In this present case cohort study, we genotyped the PVT1 eQTL (rs4733586) among 331 HCC patients and
               shed light on that the variants of SNP were significantly associated with poor prognosis in HCC.


               Several studies have shown that some locus located in PVT1 had potential risks to cancer.For example,one
               genome-wide association study identified a locus (rs1561927) at 8q24.21 that located 455 Kb telomeric of
                                                      [15]
               PVT1 associated with pancreatic cancer risk . In a comprehensive genome-wide analysis, the authors
               identified lncRNA PVT1 that may be involved in HCC cells metastasis by comparing lncRNAs expression
                     [16]
               profiles . Therefore, it is reasonable to believe that the key locus on the lncRNA PVT1 may be associated
               with the progress of HCC.

               Since thousands of new lncRNAs have been explored in the ENCODE project and RNA-seq analysis, the
                                                                                          [12]
               genetic variation and biological function of lncRNAs are becoming hot topics in cancer . SNP rs4733586
               was identified as an eQTL for PVT1 using bioinformatics analysis. PVT1 oncogene encodes a long noncoding
                                                 [17]
               RNA and maps to chromosome 8q24.21 . The well-characterized myelocytomatosis (MYC) oncogene also
                                                                                                        [9]
                                        [18]
               resides in the 8q24.21 region , and PVT1 is located downstream of MYC in this chromosomal region .
                                                                                         [19]
               Moreover, PVT1 has been shown to be important for expression of MYC in tumors . MYC activation
               may influence cancer immunoediting through the suppression of immune surveillance against tumor