
Page 296 - Read Online
P. 296
Tian et al. Hepatoma Res 2018;4:27 I http://dx.doi.org/10.20517/2394-5079.2018.24 Page 3 of 7
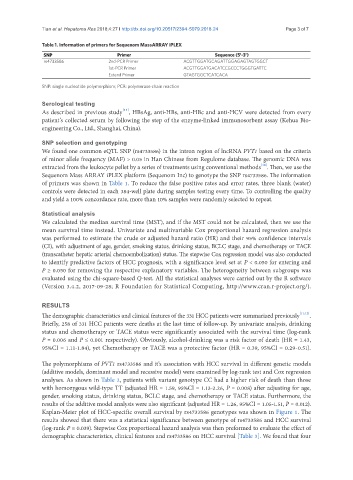
Table 1. Information of primers for Sequenom MassARRAY iPLEX
SNP Primer Sequence (5’-3’)
rs4733586 2nd-PCR Primer ACGTTGGATGCAGATTGGAGAGTAGTGGCT
1st-PCR Primer ACGTTGGATGACATCCGCCCTGGGTGATTC
Extend Primer GTAGTGGCTCATCACA
SNP: single nucleotide polymorphism; PCR: polymerase chain reaction
Serological testing
[11]
As described in previous study , HBsAg, anti-HBs, anti-HBc and anti-HCV were detected from every
patient’s collected serum by following the step of the enzyme-linked immunosorbent assay (Kehua Bio-
engineering Co., Ltd., Shanghai, China).
SNP selection and genotyping
We found one common eQTL SNP (rs4733586) in the intron region of lncRNA PVT1 based on the criteria
of minor allele frequency (MAF) > 0.05 in Han Chinese from Regulome database. The genomic DNA was
[14]
extracted from the leukocyte pellet by a series of treatments using conventional methods . Then, we use the
Sequenom Mass ARRAY iPLEX platform (Sequenom Inc) to genotype the SNP rs4733586. The information
of primers was shown in Table 1. To reduce the false positive rates and error rates, three blank (water)
controls were detected in each 384-well plate during samples testing every time. To controlling the quality
and yield a 100% concordance rate, more than 10% samples were randomly selected to repeat.
Statistical analysis
We calculated the median survival time (MST), and if the MST could not be calculated, then we use the
mean survival time instead. Univariate and multivariable Cox proportional hazard regression analysis
was performed to estimate the crude or adjusted hazard ratio (HR) and their 95% confidence intervals
(CI), with adjustment of age, gender, smoking status, drinking status, BCLC stage, and chemotherapy or TACE
(transcatheter hepatic arterial chemoembolization) status. The stepwise Cox regression model was also conducted
to identify predictive factors of HCC prognosis, with a significance level set at P < 0.050 for entering and
P ≥ 0.050 for removing the respective explanatory variables. The heterogeneity between subgroups was
evaluated using the chi-square-based Q-test. All the statistical analyses were carried out by the R software
(Version 3.4.2, 2017-09-28; R Foundation for Statistical Computing, http://www.cran.r-project.org/).
RESULTS
The demographic characteristics and clinical features of the 331 HCC patients were summarized previously [11,12] .
Briefly, 258 of 331 HCC patients were deaths at the last time of follow-up. By univariate analysis, drinking
status and chemotherapy or TACE status were significantly associated with the survival time (log-rank
P = 0.006 and P ≤ 0.001 respectively). Obviously, alcohol-drinking was a risk factor of death (HR = 1.43,
95%CI = 1.11-1.84), yet Chemotherapy or TACE was a protective factor (HR = 0.39, 95%CI = 0.29-0.51).
The polymorphisms of PVT1 rs4733586 and it’s association with HCC survival in different genetic models
(additive models, dominant model and recessive model) were examined by log-rank test and Cox regression
analyses. As shown in Table 2, patients with variant genotype CC had a higher risk of death than those
with homozygous wild-type TT (adjusted HR = 1.59, 95%CI = 1.13-2.26, P = 0.008) after adjusting for age,
gender, smoking status, drinking status, BCLC stage, and chemotherapy or TACE status. Furthermore, the
results of the additive model analysis were also significant (adjusted HR = 1.26, 95%CI = 1.05-1.51, P = 0.012).
Kaplan-Meier plot of HCC-specific overall survival by rs4733586 genotypes was shown in Figure 1. The
results showed that there was a statistical significance between genotype of rs4733586 and HCC survival
(log-rank P = 0.039). Stepwise Cox proportional hazard analysis was then preformed to evaluate the effect of
demographic characteristics, clinical features and rs4733586 on HCC survival [Table 3]. We found that four