
Page 334 - Read Online
P. 334
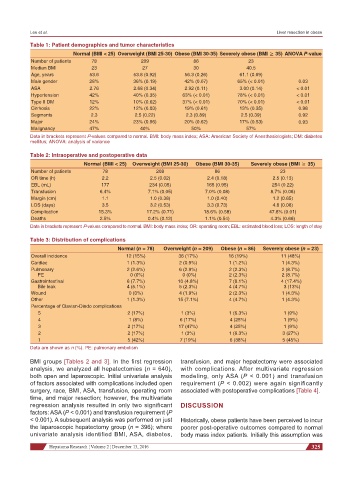
Lee et al.                                                                                                                                                                                                   Liver resection in obese

           Table 1: Patient demographics and tumor characteristics
                          Normal (BMI < 25) Overweight (BMI 25-30)  Obese (BMI 30-35) Severely obese (BMI ≥ 35)  ANOVA P-value
           Number of patients   78               209              86                 23
           Median BMI           23               27               30                40.5
           Age, years          53.6           53.8 (0.92)      56.3 (0.26)        61.1 (0.69)
           Male gender         28%            36% (0.19)       42% (0.07)        65% (< 0.01)         0.03
           ASA                 2.76           2.68 (0.34)      2.92 (0.11)        3.00 (0.14)        < 0.01
           Hypertension        42%            40% (0.35)       63% (< 0.01)      78% (< 0.01)        < 0.01
           Type II DM          12%            10% (0.62)       37% (< 0.01)      70% (< 0.01)        < 0.01
           Cirrhosis           22%            12% (0.03)       19% (0.61)         13% (0.35)          0.98
           Segments             2.3            2.5 (0.22)       2.3 (0.89)        2.5 (0.39)          0.92
           Major               24%            23% (0.96)       20% (0.62)         17% (0.53)          0.93
           Malignancy          47%              40%               50%               57%
           Data in brackets represent P-values compared to normal. BMI: body mass index; ASA: American Society of Anesthesiologists; DM: diabetes
           mellitus; ANOVA: analysis of variance

           Table 2: Intraoperative and postoperative data
                             Normal (BMI < 25)  Overweight (BMI 25-30)   Obese (BMI 30-35)   Severely obese (BMI ≥ 35)
           Number of patients       78                209                86                     23
           OR time (h)             2.2              2.5 (0.02)         2.4 (0.18)            2.5 (0.13)
           EBL (mL)                177             234 (0.05)          165 (0.95)            254 (0.22)
           Transfusion             6.4%            7.1% (0.05)        7.0% (0.08)           8.7% (0.08)
           Margin (cm)             1.1              1.0 (0.38)         1.0 (0.40)            1.2 (0.65)
           LOS (days)              3.5              3.2 (0.53)         3.3 (0.73)            4.6 (0.08)
           Complication           15.3%           17.2% (0.71)        18.6% (0.58)          47.8% (0.01)
           Deaths                  2.5%            0.4% (0.12)        1.1% (0.54)           4.3% (0.66)
           Data in brackets represent P-values compared to normal. BMI: body mass index; OR: operating room; EBL: estimated blood loss; LOS: length of stay

           Table 3: Distribution of complications
                                         Normal (n = 78)  Overweight (n = 209)  Obese (n = 86)  Severely obese (n = 23)
           Overall incidence                12 (15%)         36 (17%)         16 (19%)          11 (48%)
           Cardiac                          1 (1.3%)         2 (0.9%)         1 (1.2%)          1 (4.3%)
           Pulmonary                        2 (2.6%)         6 (2.9%)         2 (2.3%)          2 (8.7%)
                PE                            0 (0%)            0 (0%)        2 (2.3%)          2 (8.7%)
           Gastrointestinal                 6 (7.7%)         10 (4.8%)        7 (8.1%)          4 (17.4%)
                Bile leak                   4 (5.1%)         5 (2.3%)         4 (4.7%)            3 (13%)
           Wound                             0 (0%)          4 (1.9%)         2 (2.3%)          1 (4.3%)
           Other                            1 (1.3%)         15 (7.1%)        4 (4.7%)          1 (4.3%)
           Percentage of Clavian-Dindo complications
              5                             2 (17%)           1 (3%)          1 (6.3%)           1 (9%)
              4                              1 (8%)           6 (17%)          4 (25%)           1 (9%)
              3                             2 (17%)          17 (47%)          4 (25%)           1 (9%)
              2                             2 (17%)           1 (3%)          1 (6.3%)          3 (27%)
              1                             5 (42%)           7 (19%)          6 (38%)          5 (45%)
           Data are shown as n (%). PE: pulmonary embolism

           BMI groups [Tables 2 and 3]. In the first regression   transfusion, and major hepatectomy were associated
           analysis, we analyzed all hepatectomies (n = 640),   with complications. After multivariate regression
           both open and laparoscopic. Initial univariate analysis   modeling, only ASA (P < 0.001) and transfusion
           of factors associated with complications included open   requirement (P < 0.002) were again significantly
           surgery, race, BMI, ASA, transfusion, operating room   associated with postoperative complications [Table 4].
           time, and major resection; however, the multivariate
           regression analysis resulted in only two significant   DISCUSSION
           factors: ASA (P < 0.001) and transfusion requirement (P
           < 0.001). A subsequent analysis was performed on just   Historically, obese patients have been perceived to incur
           the laparoscopic hepatectomy group (n = 396); where   poorer post-operative outcomes compared to normal
           univariate analysis identified BMI, ASA, diabetes,   body mass index patients. Initially this assumption was

                           Hepatoma Research ¦ Volume 2 ¦ December 13, 2016                               325