
Page 31 - Read Online
P. 31
EGF level in HCC patients with one focal lesion was 757.1 invasions, and patient survival. Subjects of our study
± 327.8 pic/mL, in those with 2 focal lesions was 873.8 were selected from the Hepatology Clinics, National
± 334.7 pic/mL, and in those with multiple focal lesions Liver Institute, Menoufia University in the period from
was 775.2 ± 293.9 pic/mL (P < 0.05) [Table 9]. Serum June 2010 to June 2011. Four groups of patients were
EGF levels were strongly correlated to the tumor size and studied: Group I comprised 51 patients with unresectable
serum AFP levels (using Spearman correlation test, with HCC (which were further subdivided according to the
P < 0.05). eligibility for TACE into subgroups Ia and Ib), group II
comprised 40 chronic hepatitis C patients, and group
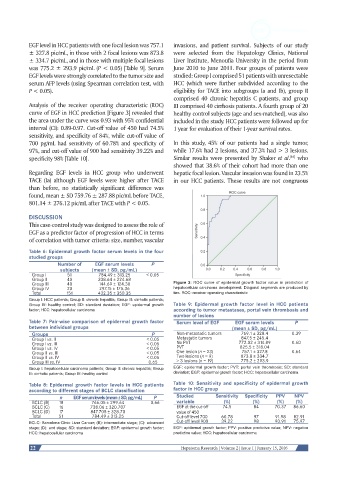
Analysis of the receiver operating characteristic (ROC) III comprised 40 cirrhosis patients. A fourth group of 20
curve of EGF in HCC prediction [Figure 3] revealed that healthy control subjects (age and sex-matched), was also
the area under the curve was 0.93 with 95% confidential included in the study. HCC patients were followed up for
interval (CI): 0.89-0.97. Cut-off value of 450 had 74.5% 1 year for evaluation of their 1-year survival rates.
sensitivity, and specificity of 84%, while cut-off value of
700 pg/mL had sensitivity of 60.78% and specificity of In this study, 45% of our patients had a single tumor,
97%, and cut-off value of 900 had sensitivity 39.22% and while 17.6% had 2 lesions, and 37.3% had > 3 lesions.
[16]
specificity 98% [Table 10]. Similar results were presented by Shaker et al. who
showed that 38.6% of their cohort had more than one
Regarding EGF levels in HCC group who underwent hepatic focal lesion. Vascular invasion was found in 23.5%
TACE (Ia) although EGF levels were higher after TACE in our HCC patients. These results are not congruous
than before, no statistically significant difference was
found, mean ± SD 759.76 ± 287.88 pic/mL before TACE,
801.14 ± 276.12 pic/mL after TACE with P < 0.05.
DISCUSSION
This case-control study was designed to assess the role of
EGF as a predictor factor of progression of HCC in terms
of correlation with tumor criteria: size, number, vascular
Table 6: Epidermal growth factor serum levels in the four
studied groups
Number of EGF serum levels P
subjects (mean ± SD, pg/mL)
Group I 51 784.49 ± 313.25 < 0.05
Group II 40 338.64 ± 224.68
Group III 40 144.69 ± 124.30 Figure 3: ROC curve of epidermal growth factor value in prediction of
Group IV 20 297.15 ± 175.36 hepatocellular carcinoma development. Diagonal segments are produced by
Total 151 432.35 ± 350.35 ties. ROC: receiver operating characteristic
Group I: HCC patients; Group II: chronic hepatitis; Group III: cirrhotic patients;
Group IV: healthy control; SD: standard deviation; EGF: epidermal growth Table 9: Epidermal growth factor level in HCC patients
factor; HCC: hepatocellular carcinoma according to tumor metastases, portal vein thrombosis and
number of lesions
Table 7: Pair-wise comparison of epidermal growth factor Serum level of EGF EGF serum levels P
between individual groups (mean ± SD, pg/mL)
Groups P Non-metastatic tumors 769.1 ± 328.4 0.39
Group I vs. II < 0.05 Metastatic tumors 847.5 ± 245.4
Group I vs. III < 0.05 No PVT 772.02 ± 314.89 0.60
Group I vs. IV < 0.05 PVT 825.5 ± 318.04
Group II vs. III < 0.05 One lesion (n = 23) 757.1 ± 327.8 0.64
Group II vs. IV < 0.05 Two lesions (n = 9) 873.8 ± 334.7
Group III vs. IV 0.65 ≥ 3 lesions (n = 19) 775.2 ± 293.9
Group I: hepatocellular carcinoma patients; Group II: chronic hepatitis; Group EGF: epidermal growth factor; PVT: portal vein thrombosis; SD: standard
III: cirrhotic patients; Group IV: healthy control deviation; EGF: epidermal growth factor; HCC: hepatocellular carcinoma
Table 8: Epidermal growth factor levels in HCC patients Table 10: Sensitivity and specificity of epidermal growth
according to different stages of BCLC classification factor in HCC group
n EGF serum levels (mean ± SD, pg/mL) P Studied Sensitivity Specificity PPV NPV
BCLC (B) 18 766.05 ± 299.64 0.66 variable (%) (%) (%) (%)
BCLC (C) 16 738.06 ± 320.707 EGF at the cut-off 74.5 84 70.37 86.60
BCLC (D) 17 847.705 ± 328.70 value of 450
Total 51 784.49 ± 313.25 Cut-off level 700 60.78 97 91.98 82.91
BCLC: Barcelona-Clinic Liver Cancer; (B): intermediate stage; (C): advanced Cut-off level 900 39.22 98 90.91 75.97
stage; (D): end stage; SD: standard deviation; EGF: epidermal growth factor; EGF: epidermal growth factor; PPV: positive predictive value; NPV: negative
HCC: hepatocellular carcinoma predictive value; HCC: hepatocellular carcinoma
22 Hepatoma Research | Volume 2 | Issue 1 | January 15, 2016