
Page 30 - Read Online
P. 30
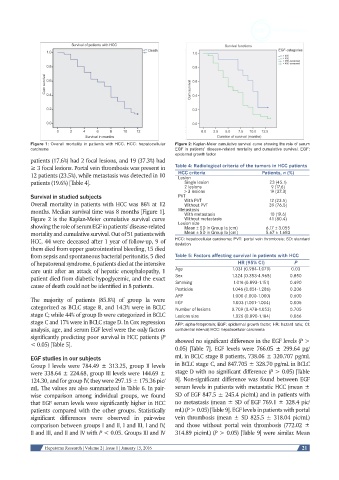
Figure 1: Overall mortality in patients with HCC. HCC: hepatocellular   Figure 2: Kaplan-Meier cumulative survival curve showing the role of serum
            carcinoma                                          EGF in patients’ disease-related mortality and cumulative survival. EGF:
                                                               epidermal growth factor
            patients (17.6%) had 2 focal lesions, and 19 (37.3%) had
            ≥ 3 focal lesions. Portal vein thrombosis was present in   Table 4: Radiological criteria of the tumors in HCC patients
            12 patients (23.5%), while metastasis was detected in 10   HCC criteria          Patients, n (%)
                                                                Lesion
            patients (19.6%) [Table 4].                           Single lesion                 23 (45.1)
                                                                  2 lesions                     9 (17.6)
                                                                  > 3 lesions                   19 (37.3)
            Survival in studied subjects                        PVT
            Overall mortality in patients with HCC was 86% at 12   With PVT                     12 (23.5)
                                                                  Without PVT
                                                                                                39 (76.5)
            months. Median survival time was 8 months [Figure 1].   Metastasis                  10 (19.6)
                                                                  With metastasis
            Figure 2 is the Kaplan-Meier cumulative survival curve   Without metastasis         41 (80.4)
            showing the role of serum EGF in patients’ disease-related   Lesion size          6.17 ± 3.055
                                                                  Mean ± SD in Group Ia (cm)
            mortality and cumulative survival. Out of 51 patients with   Mean ± SD in Group Ib (cm)  5.67 ± 1.683
            HCC, 44 were deceased after 1 year of follow-up, 9 of   HCC: hepatocellular carcinoma; PVT: portal vein thrombosis; SD: standard
                                                               deviation
            them died from upper gastrointestinal bleeding, 15 died
            from sepsis and spontaneous bacterial peritonitis, 5 died   Table 5: Factors affecting survival in patients with HCC
            of hepatorenal syndrome, 6 patients died at the intensive                HR (95% CI)        P
            care unit after an attack of hepatic encephalopathy, 1   Age           1.031 (0.984-1.079)  0.03
            patient died from diabetic hypoglycemic, and the exact   Sex          1.324 (0.353-4.965)  0.850
            cause of death could not be identified in 8 patients.  Smoking         1.014 (0.893-1.151)  0.490
                                                               Pesticide           1.046 (0.851-1.286)  0.206
                                                               AFP                 1.000 (1.000-1.000)  0.600
            The majority of patients (85.8%) of group Ia were   EGF                1.003 (1.001-1.004)  0.005
            categorized as BCLC stage B, and 14.3% were in BCLC   Number of lesions  0.709 (0.478-1.053)  0.705
            stage C; while 44% of group Ib were categorized in BCLC   Lesions size  1.026 (0.890-1.184)  0.066
            stage C and 17% were in BCLC stage D. In Cox regression   AFP: alpha-fetoprotein; EGF: epidermal growth factor; HR: hazard ratio; CI:
            analysis, age, and serum EGF level were the only factors   confidential interval; HCC: hepatocellular carcinoma
            significantly predicting poor survival in HCC patients (P   showed no significant difference in the EGF levels (P >
            < 0.05) [Table 5].
                                                               0.05) [Table 7]. EGF levels were 766.05 ± 299.64 pg/
            EGF studies in our subjects                        mL in BCLC stage B patients, 738.06 ± 320.707 pg/mL
            Group I levels were 784.49 ± 313.25, group II levels   in BCLC stage C, and 847.705 ± 328.70 pg/mL in BCLC
            were 338.64 ± 224.68, group III levels were 144.69 ±   stage D with no significant difference (P > 0.05) [Table
            124.30, and for group IV, they were 297.15 ± 175.36 pic/  8]. Non-significant difference was found between EGF
            mL. The values are also summarized in Table 6. In pair-  serum levels in patients with metastatic HCC (mean ±
            wise  comparison  among  individual  groups,  we  found   SD of EGF 847.5 ± 245.4 pic/mL) and in patients with
            that EGF serum levels were significantly higher in HCC   no metastasis (mean ± SD of EGF 769.1 ± 328.4 pic/
            patients compared with the other groups. Statistically   mL) (P > 0.05) [Table 9]. EGF levels in patients with portal
            significant differences were observed in pair-wise   vein thrombosis (mean ± SD 825.5 ± 318.04 pic/mL)
            comparison between groups I and II, I and III, I and IV,   and those without portal vein thrombosis (772.02 ±
            II and III, and II and IV with P < 0.05. Groups III and IV   314.89 pic/mL) (P > 0.05) [Table 9] were similar. Mean


                 Hepatoma Research | Volume 2 | Issue 1 | January 15, 2016                                 21