
Page 235 - Read Online
P. 235
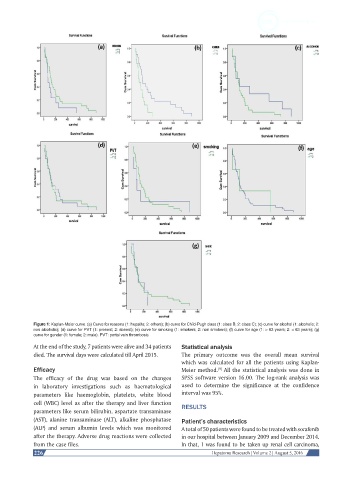
Figure 1: Kaplan-Meier curve. (a) Curve for reasons (1: hepatits; 2: others); (b) curve for Child-Pugh class (1: class B; 2: class C); (c) curve for alcohol (1: alcoholic; 2:
            non alcoholic); (d) curve for PVT (1: present; 2: absent); (e) curve for smoking (1: smokers; 2: non smokers); (f) curve for age (1: > 63 years; 2: < 63 years); (g)
            curve for gender (1: female; 2: male). PVT: portal vein thrombosis
            At the end of the study, 7 patients were alive and 34 patients   Statistical analysis
            died. The survival days were calculated till April 2015.  The  primary  outcome  was the  overall mean  survival
                                                              which was calculated for all the patients using Kaplan-
            Efficacy                                          Meier method.  All the statistical analysis was done in
                                                                           [9]
            The efficacy of the drug was based on the changes   SPSS software version 16.00. The log-rank analysis was
            in laboratory investigations  such as haematological   used to determine  the significance at the confidence
            parameters like haemoglobin,  platelets, white  blood   interval was 95%.
            cell (WBC) level as after the therapy and liver function
            parameters like serum bilirubin, aspartate transaminase   RESULTS
            (AST), alanine transaminase (ALT), alkaline phosphatase   Patient’s characteristics
            (ALP)  and serum  albumin  levels  which  was  monitored   A total of 50 patients were found to be treated with sorafenib
            after the therapy. Adverse drug reactions were collected   in our hospital between January 2009 and December 2014.
            from the case files.                              In that, 1 was found to be taken up renal cell carcinoma,
             226                                                        Hepatoma Research | Volume 2 | August 5, 2016