
Page 110 - Read Online
P. 110
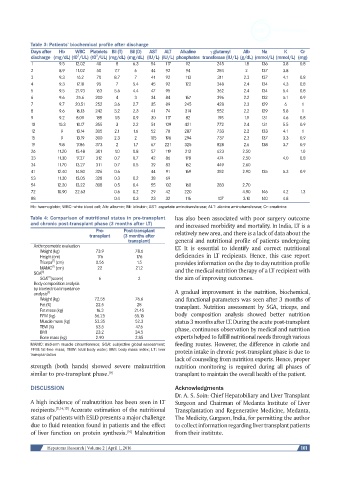
Table 3: Patients’ biochemical profile after discharge
            Days after   Hb   WBC  Platelets  Bil (T)   Bil (D)   AST   ALT   Alkaline   γ glutamyl   Alb   Na   K   Cr
                            3
                                   3
            discharge (mg/dL) (10 /UL) (10 /UL) (mg/dL) (mg/dL) (IU/L) (IU/L) phosphates transferase (IU/L) (g/dL) (mmol/L) (mmol/L) (mg)
            1         9.5  12.02   40     8     6.3   54   117    92         245       1.8   136    3.8   0.8
            2         8.9   11.02  50    7.7    6     44   92     94         284       2     137    3.8
            3         9.3   16.2   70    8.7    7     41   92     113        311       2.3   137    4.1   0.8
            4         9.3   17.18  95     7     5.4   45   92     122        348       2.4   134    4.3   0.8
            5         9.5  21.93   163   5.6    4.4   47   95                362       2.4   134    5.4   0.8
            6         9.6   25.6  200     4     3     34   84     167        396       2.2   132    5.1   0.9
            7         9.7  20.51  252    3.6    2.7   35   89     245        428       2.3   129     6     1
            8         9.6   16.13  242   3.2    2.3   41   74     314        552       2.2   129    5.8    1
            9         9.2   8.09   185   1.5    0.9   30   117    82         195       1.9   131    4.6   0.8
            10       10.3   10.17  355    3     2.2   51   109    421        772       2.4   131    5.5   0.9
            12        9     13.14  305   2.1    1.6   52   78     287        733       2.2   133    4.1    1
            15        9     13.19  300   2.3    2     105  196    294        737       2.3   137    3.3   0.9
            19        9.8   17.86  373    2     1.7   67   221    325        828       2.6   138    3.7   0.9
            26       11.20  15.48  301   1.0    0.8   57   119    213        623      2.50                1.0
            33       11.30  17.37  312   0.7    0.7   42   86     178        474      2.50          4.0   0.8
            34       11.70  13.27  311   0.7    0.5   39   83     162        449      2.60
            41       12.40  14.80  326   0.6          44   91     169        382      2.90   135    5.3   0.9
            53       11.30  13.05  328   0.3    0.2   38   69
            54       12.20  13.22  308   0.5    0.4   55   102    160        283      2.70
            72       10.90  22.63        0.6    0.2   29   42     220                 4.90   146    4.2   1.3
            88                           0.4    0.3   23   32     116        107      3.10   140    4.8
            Hb: haemoglobin; WBC: white blood cell; Alb: albumin; Bili: bilirubin; AST: aspartate aminotransferase; ALT: alanine aminotransferase; Cr: creatinine
            Table 4: Comparison of nutritional status in pre-transplant   has also been associated with poor surgery outcome
            and chronic post-transplant phase (3 months after LT)  and increased morbidity and mortality. In India, LT is a
                                   Pre-     Post-transplant    relatively new area, and there is a lack of data about the
                                transplant  (3 months after
                                              transplant)      general and nutritional profile of patients undergoing
             Anthropometric evaluation                         LT.  It  is  essential  to  identify  and  correct  nutritional
               Weight (kg)         73.9         78.6
               Height (cm)         176           176           deficiencies in LT recipients. Hence, this case report
                   [7]
               Triceps  (cm)       0.56          1.5           provides information on the day to day nutrition profile
                   [7]
               MAMC  (cm)          22            21.2          and the medical nutrition therapy of a LT recipient with
             SGA [8]
               SGA (score)          6            2             the aim of improving outcomes.
                  [8]
             Body composition analysis
             by bioelectrical impedance
             analysis [9]                                      A gradual improvement in the nutrition, biochemical,
               Weight (kg)        72.55          76.6          and functional parameters was seen after 3 months of
               Fat (%)             22.5          28            transplant. Nutrition assessment by SGA, triceps, and
               Fat mass (kg)       16.3         21.45
               FFM (kg)           56.25         55.15          body composition analysis showed better nutrition
               Muscle mass (kg)   53.35         52.3           status 3 months after LT. During the acute post-transplant
               TBW (%)             53.5          47.6          phase, continuous observation by medical and nutrition
               BMI                 23.2         24.5
               Bone mass (kg)      2.90         2.85           experts helped to fulfill nutritional needs through various
            MAMC: mid-arm muscle circumference; SGA: subjective global assessment;   feeding routes. However, the difference in calorie and
            FFM: fat-free mass; TBW: total body water; BMI: body mass index; LT: liver   protein intake in chronic post-transplant phase is due to
            transplantation
                                                               lack of counseling from nutrition experts. Hence, proper
            strength (both hands) showed severe malnutrition   nutrition  monitoring  is  required  during  all  phases  of
            similar to pre-transplant phase. [9]               transplant to maintain the overall health of the patient.

            DISCUSSION                                         Acknowledgments
                                                               Dr. A. S. Soin: Chief Hepatobiliary and Liver Transplant
            A high incidence of malnutrition has been seen in LT   Surgeon  and  Chairman  of  Medanta  Institute  of  Liver
            recipients. [5,14,15]  Accurate estimation of the nutritional   Transplantation and Regenerative Medicine, Medanta,
            status of patients with ESLD presents a major challenge   The Medicity, Gurgaon, India, for permitting the author
            due to fluid retention found in patients and the effect   to collect information regarding liver transplant patients
            of liver function on protein synthesis.  Malnutrition   from their institute.
                                              [16]

                  Hepatoma Research | Volume 2 | April 1, 2016                                             101