
Page 109 - Read Online
P. 109
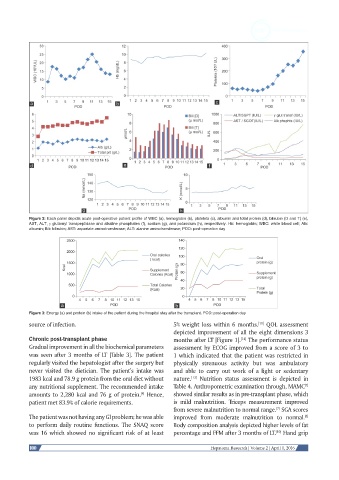
Figure 2: Each panel depicts acute post-operative patient profile of WBC (a), hemoglobin (b), platelets (c), albumin and total protein (d), bilirubin (D and T) (e),
           AST, ALT, γ glutamyl transpeptidase and alkaline phosphates (f), sodium (g), and potassium (h), respectively. Hb: hemoglobin; WBC: white blood cell; Alb:
           albumin; Bili: bilirubin; AST: aspartate aminotransferase; ALT: alanine aminotransferase; POD: post-operation day


           Figure 3: Energy (a) and protein (b) intake of the patient during the hospital stay after the transplant. POD: post-operation day
           source of infection.                               5% weight loss within 6 months.  QOL assessment
                                                                                            [11]
                                                              depicted improvement of all the eight dimensions 3
           Chronic post-transplant phase                      months after LT [Figure 1].  The performance status
                                                                                      [14]
           Gradual improvement in all the biochemical parameters   assessment by ECOG improved from a score of 3 to
           was seen after 3 months of LT [Table 3]. The patient   1 which indicated that the patient was restricted in
           regularly visited the hepatologist after the surgery but   physically strenuous activity but was ambulatory
           never visited the dietician. The patient’s intake was   and able to carry out work of a light or sedentary
           1983 kcal and 78.9 g protein from the oral diet without   nature.   Nutrition status assessment is depicted in
                                                                    [13]
           any nutritional supplement. The recommended intake   Table 4. Anthropometric examination through, MAMC
                                                                                                            [7]
           amounts to 2,280 kcal and 76 g of protein.  Hence,   showed similar results as in pre-transplant phase, which
                                                  [4]
           patient met 83.9% of calorie requirements.         is  mild  malnutrition.  Triceps  measurement  improved
                                                              from severe malnutrition to normal range.  SGA scores
                                                                                                  [7]
           The patient was not having any GI problem; he was able   improved  from  moderate malnutrition to  normal.
                                                                                                            [8]
           to perform daily routine functions. The SNAQ score   Body composition analysis depicted higher levels of fat
           was 16 which showed no significant risk of at least   percentage and FFM after 3 months of LT.  Hand grip
                                                                                                  [10]
           100                                                             Hepatoma Research | Volume 2 | April 1, 2016