Page 21 - Read Online
P. 21

Daniele et al. Hepatoma Res 2021;7:61  https://dx.doi.org/10.20517/2394-5079.2021.58  Page 9 of 14

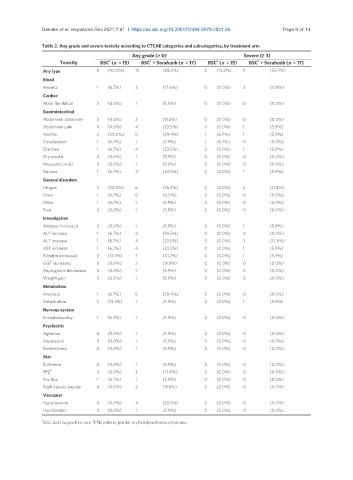
               Table 2. Any grade and severe toxicity according to CTCAE categories and subcategories, by treatment arm
                                              Any grade (> 0)                      Severe (≥ 3)
                     Toxicity      BSC  (n  = 15)  BSC  + Sorafenib (n  = 17)  BSC  (n  = 15)  BSC  + Sorafenib (n  = 17)
                                      †
                                                    †
                                                                                        †
                                                                          †
                Any type          6  (40.0%)   15       (88.2%)       2   (13.3%)  9        (52.9%)
                Blood
                Anemia            1  (6.7%)    3        (17.6%)       0   (0.0%)   2        (11.8%)
                Cardiac
                Atrial fibrillation  0  (0.0%)  1       (5.9%)        0   (0.0%)   0        (0.0%)
                Gastrointestinal
                Abdominal distension  0  (0.0%)  2      (11.8%)       0   (0.0%)   0        (0.0%)
                Abdominal pain    0  (0.0%)    4        (23.5%)       0   (0.0%)   1        (5.9%)
                Ascites           3  (20.0%)   5        (29.4%)       1   (6.7%)   1        (5.9%)
                Constipation      1  (6.7%)    1        (5.9%)        1   (6.7%)   0        (0.0%)
                Diarrhea          1  (6.7%)    4        (23.5%)       0   (0.0%)   1        (5.9%)
                Dry mouth         0  (0.0%)    1        (5.9%)        0   (0.0%)   0        (0.0%)
                Mucositis (oral)  0  (0.0%)    1        (5.9%)        0   (0.0%)   0        (0.0%)
                Nausea            1  (6.7%)    4        (23.5%)       0   (0.0%)   1        (5.9%)
                General disorders
                Fatigue           3  (20.0%)   6        (35.3%)       0   (0.0%)   2        (11.8%)
                Fever             1  (6.7%)    0        (0.0%)        0   (0.0%)   0        (0.0%)
                Other             1  (6.7%)    1        (5.9%)        0   (0.0%)   0        (0.0%)
                Pain              0  (0.0%)    1        (5.9%)        0   (0.0%)   0        (0.0%)
                Investigation
                Amylase increased  0  (0.0%)   1        (5.9%)        0   (0.0%)   1        (5.9%)
                ALP increase      1  (6.7%)    4        (23.5%)       0   (0.0%)   0        (0.0%)
                ALT increase      1  (6.7%)    4        (23.5%)       0   (0.0%)   3        (17.6%)
                AST increase      1  (6.7%)    4        (23.5%)       0   (0.0%)   1        (5.9%)
                Bilirubin increased  2  (13.3%)  7      (41.2%)       0   (0.0%)   1        (5.9%)
                GGT increased     0  (0.0%)    2        (11.8%)       0   (0.0%)   0        (0.0%)
                Haptoglobin decreased  0  (0.0%)  1     (5.9%)        0   (0.0%)   0        (0.0%)
                Weight gain       0  (0.0%)    1        (5.9%)        0   (0.0%)   0        (0.0%)
                Metabolism
                Anorexia          1  (6.7%)    5        (29.4%)       0   (0.0%)   0        (0.0%)
                Dehydration       2  (13.3%)   1        (5.9%)        0   (0.0%)   1        (5.9%)
                Nervous system
                Encephalopathy    1  (6.7%)    1        (5.9%)        0   (0.0%)   0        (0.0%)
                Psychiatric
                Agitation         0  (0.0%)    1        (5.9%)        0   (0.0%)   0        (0.0%)
                Depression        0  (0.0%)    1        (5.9%)        0   (0.0%)   0        (0.0%)
                Restlessness      0  (0.0%)    1        (5.9%)        0   (0.0%)   0        (0.0%)
                Skin
                Erythema          0  (0.0%)    1        (5.9%)        0   (0.0%)   0        (0.0%)
                  ‡
                PPE               0  (0.0%)    3        (17.6%)       0   (0.0%)   0        (0.0%)
                Pruritus          1  (6.7%)    1        (5.9%)        0   (0.0%)   0        (0.0%)
                Rash maculo papular  0  (0.0%)  2       (11.8%)       0   (0.0%)   0        (0.0%)
                Vascualar
                Hypertension      0  (0.0%)    4        (23.5%)       0   (0.0%)   0        (0.0%)
                Hypotension       0  (0.0%)    1        (5.9%)        0   (0.0%)   0        (0.0%)
               †                ‡
                BSC: Best supportive care;  PPE: palmar-plantar erythrodysesthesia syndrome.
   16   17   18   19   20   21   22   23   24   25   26