
Page 31 - Read Online
P. 31
Data in Figure 5b show that AZA treatment induced a architecture [Figure 6]. The liver sections obtained from
significant increase in mean relative liver weight (RLW) FSME and CFME treated rats showed more or less normal
when compared to normal control rats. However, the oral hepatocytes architecture, but some congested blood
administration of CFME or FSME did not significantly affect vessels were seen in FSME-treated rats [Figure 7] and mild
the mean RLW. The pre-treatment with CFME did not improve inflammation around the portal tract in the CFME-treated
the increase in mean RLW ratio induced by AZA treatment, rats [Figure 8]. In contrast, the liver sections obtained from the
but the administration with FSME ameliorated the increase AZA-treated rats revealed hepatocytes disorganization, and
in mean RLW induced by AZA treatment. fatty degeneration as indicated by large and microvesicular
fat droplets. The hepatocytes nuclei were shrinked and
The light microscopical examination of the liver sections pyknotic or apoptotic. There were areas of hemorrhages
from the control rats revealed normal hepatocytes in blood vessels and in between hepatocytes. Hepatocytes
a b
c
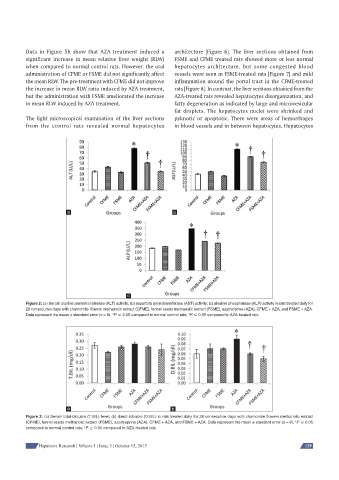
Figure 2: (a) Serum alanine aminotransferase (ALT) activity; (b) aspartate aminotransferase (AST) activity; (c) alkaline phosphatase (ALP) activity in rats treated daily for
28 consecutive days with chamomile fl owers methanolic extract (CFME), fennel seeds methanolic extract (FSME), azathioprine (AZA), CFME + AZA, and FSME + AZA.
†
Data represent the mean ± standard error (n = 8). *P ≤ 0.05 compared to normal control rats; P ≤ 0.05 compared to AZA-treated rats
a b
Figure 3: (a) Serum total-bilirubin (T.BIL) level; (b) direct-bilirubin (D.BIL) in rats treated daily for 28 consecutive days with chamomile fl owers methanolic extract
(CFME), fennel seeds methanolic extract (FSME), azathioprine (AZA), CFME + AZA, and FSME + AZA. Data represent the mean ± standard error (n = 8). *P ≤ 0.05
compared to normal control rats; P ≤ 0.05 compared to AZA-treated rats
†
Hepatoma Research | Volume 1 | Issue 3 | October 15, 2015 129