
Page 43 - Read Online
P. 43
Kwee et al. Hepatoma Res 2021;7:8 I http://dx.doi.org/10.20517/2394-5079.2020.124 Page 9 of 13
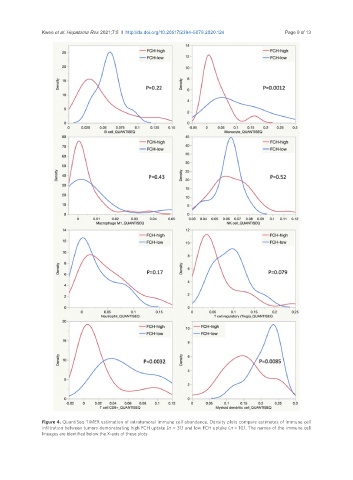
Figure 4. QuantiSeq TIMER estimation of intratumoral immune cell abundance. Density plots compare estimates of immune cell
infiltration between tumors demonstrating high FCH uptake (n = 31) and low FCH uptake (n = 10). The names of the immune cell
lineages are identified below the X-axis of these plots