
Page 41 - Read Online
P. 41
Kwee et al. Hepatoma Res 2021;7:8 I http://dx.doi.org/10.20517/2394-5079.2020.124 Page 7 of 13
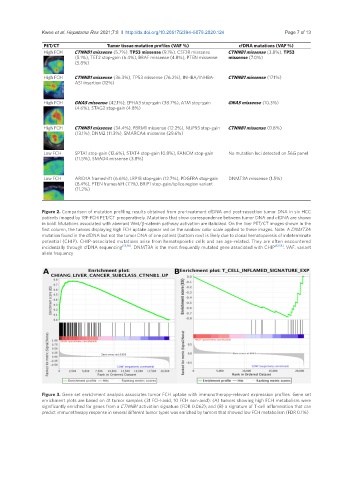
PET/CT Tumor tissue mutation profiles (VAF %) cfDNA mutations (VAF %)
High FCH CTNNB1 missense (5.7%), TP53 missense (9.1%), CSF3R missense CTNNB1 missense (3.8%), TP53
(5.1%), TET2 stop-gain (6.4%), BRAF missense (4.8%), PTEN missense missense (7.0%)
(5.8%)
High FCH CTNNB1 missense (36.3%), TP53 missense (76.2%), INHBA/INHBA- CTNNB1 missense (17.1%)
AS1 insertion (12%)
High FCH GNAS missense (42.1%), EPHA3 stop-gain (38.7%), ATM stop-gain GNAS missense (10.3%)
(4.6%), STAG2 stop-gain (4.8%)
High FCH CTNNB1 missense (34.4%), PBRM1 missense (12.2%), NUP93 stop-gain CTNNB1 missense (0.8%)
(13.1%), DNM2 (11.3%), SMARCA4 missense (29.6%)
Low FCH SPTA1 stop-gain (12.6%), STAT4 stop-gain 10.8%), FANCM stop-gain No mutation loci detected on 56G panel
(11.5%), SMAD4 missense (3.8%)
Low FCH ARID1A frameshift (6.6%), LRP1B stop-gain (12.7%), PDGFRA stop-gain DNMT3A missense (1.5%)
(8.4%), PTEN frameshift (7.1%), BRIP1 stop-gain/splice region variant
(11.2%)
Figure 2. Comparison of mutation profiling results obtained from pre-treatment cfDNA and post-resection tumor DNA in six HCC
patients imaged by 18F-FCH PET/CT preoperatively. Mutations that show correspondence between tumor DNA and cfDNA are shown
in bold. Mutations associated with aberrant Wnt/b-catenin pathway activation are italicized. On the liver PET/CT images shown in the
first column, the tumors displaying high FCH uptake appear red on the rainbow color scale applied to these images. Note: A DNMT3A
mutation found in the cfDNA but not the tumor DNA of one patient (bottom row) is likely due to clonal hematopoiesis of indeterminate
potential (CHIP). CHIP-associated mutations arise from hematopoietic cells and are age-related. They are often encountered
incidentally through cfDNA sequencing [55,56] . DNMT3A is the most frequently mutated gene associated with CHIP [57,58] . VAF: variant
allele frequency
Figure 3. Gene set enrichment analysis associates tumor FCH uptake with immunotherapy-relevant expression profiles. Gene set
enrichment plots are based on 41 tumor samples (31 FCH-avid, 10 FCH non-avid): (A) tumors showing high FCH metabolism were
significantly enriched for genes from a CTNNB1 activation signature (FDR 0.062); and (B) a signature of T-cell inflammation that can
predict immunotherapy response in several different tumor types was enriched by tumors that showed low FCH metabolism (FDR 0.116)