
Page 16 - Read Online
P. 16
Page 4 of 16 Zhang et al. Hepatoma Res 2020;6:30 I http://dx.doi.org/10.20517/2394-5079.2020.17
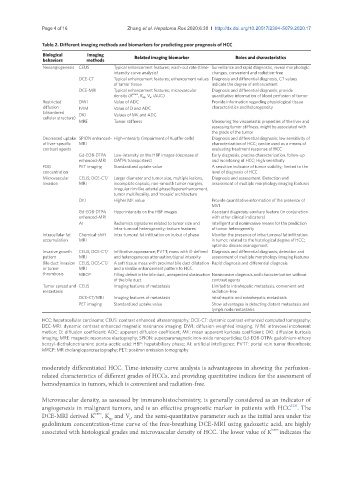
Table 2. Different imaging methods and biomarkers for predicting poor prognosis of HCC
Biological Imaging
behaviors methods Related imaging biomarker Roles and characteristics
Neoangiogenesis CEUS Typical enhancement features; wash-out rate (time- Surveillance and rapid diagnostic, reveal morphologic
intensity curve analysis) changes, convenient and radiation-free
DCE-CT Typical enhancement features; enhancement values Diagnosis and differential diagnosis, CT values
of tumor tissue indicate the degree of enhancement
DCE-MRI Typical enhancement features; microvascular Diagnosis and differential diagnosis, provide
density (K trans , K ep , V e , iAUC) quantitative information of blood perfusion of tumor
Restricted DWI Value of ADC Provide information regarding physiological tissue
diffusion IVIM Value of D and ADC characteristics and heterogeneity
(disordered DKI Values of MK and ADC
cellular structure)
MRE Tumor stiffness Measuring the viscoelastic properties of the liver and
assessing tumor stiffness, might be associated with
the grade of the tumor
Decreased uptake SPION enhanced- High-intensity (impairment of Kupffer cells) Diagnosis and differential diagnosis; low sensitivity of
of liver-specific MRI characterization of HCC; can be used as a means of
contrast agents evaluating treatment response of HCC
Gd-EOB-DTPA Low-intensity on the HBP images (decrease of Early diagnosis, precise characterization, follow-up
enhanced-MRI OATPs transporters) and monitoring of HCC; High sensitivity
FDG PET imaging Standardized uptake value A sensitive indicator of tumor viability; limited to the
concentration level of diagnosis of HCC
Microvascular CEUS; DCE-CT/ Larger diameter and tumor size, multiple lesions, Diagnosis and assessment. Detection and
invasion MRI incomplete capsule, non-smooth tumor margins, assessment of multiple morphology imaging features
irregular rim-like arterial phase hyperenhancement,
tumor multifocality, and ‘mosaic’ architecture
DKI Higher MK value Provide quantitative information of the presence of
MVI
Gd-EOB-DTPA Hypo-intensity on the HBP images Assistant diagnosis; auxiliary feature (in conjunction
enhanced-MRI with other clinical indicators)
AI Radiomics signatures related to tumor size and Intelligent and noninvasive means for the prediction
intra-tumoral heterogeneity; texture features of tumor heterogeneity
Intracellular fat Chemical-shift Intra-tumoral fat infiltration on in/out of phase Monitor the presence of intra-tumoral fat infiltration
accumulation MRI in tumor; related to the histological degree of HCC;
optimize disease management
Invasive growth CEUS; DCE-CT/ Infiltrative appearance; PVTT; mass with ill-defined Diagnosis and differential diagnosis; detection and
pattern MRI and heterogeneous attenuation/signal intensity assessment of multiple morphology imaging features
Bile duct invasion CEUS; DCE-CT/ A soft tissue mass with proximal bile duct dilatation Rapid diagnosis and differential diagnosis
or tumor MRI and a similar enhancement pattern to HCC
thrombosis MRCP Filling defect in the bile duct, unexpected obstruction Noninvasive diagnosis and characterization without
of the bile duct contrast agents
Tumor spread and CEUS Imaging features of metastasis Limited to intrahepatic metastasis, convenient and
metastasis radiation-free
DCE-CT/MRI Imaging features of metastasis Intrahepatic and extrahepatic metastasis
PET imaging Standardized uptake value Show advantages in detecting distant metastasis and
lymph node metastasis
HCC: hepatocellular carcinoma; CEUS: contrast enhanced ultrasonography; DCE-CT: dynamic contrast enhanced computed tomography;
DEC-MRI: dynamic contrast enhanced magnetic resonance imaging; DWI: diffusion-weighted imaging; IVIM: intravoxel incoherent
motion; D: diffusion coefficient: ADC: apparent diffusion coefficient; MK: mean apparent kurtosis coefficient; DKI: diffusion kurtosis
imaging; MRE: magnetic resonance elastography; SPION: superparamagnetic iron-oxide nanoparticles; Gd-EOB-DTPA: gadolinium-ethoxy
benzyl-diethylenetriamine penta-acetic acid; HBP: hepatobiliary phase; AI: artificial intelligence; PVTT: portal vein tumor thrombosis;
MRCP: MR cholangiopancreatography; PET: positron emission tomography
moderately differentiated HCC. Time-intensity curve analysis is advantageous in showing the perfusion-
related characteristics of different grades of HCCs, and providing quantitative indices for the assessment of
hemodynamics in tumors, which is convenient and radiation-free.
Microvascular density, as assessed by immunohistochemistry, is generally considered as an indicator of
[22]
angiogenesis in malignant tumors, and is an effective prognostic marker in patients with HCC . The
DCE-MRI derived K , K and V, and the semi-quantitative parameter such as the initial area under the
trans
ep
e
gadolinium concentration-time curve of the free-breathing DCE-MRI using gadoxetic acid, are highly
associated with histological grades and microvascular density of HCC. The lower value of K trans indicates the