
Page 15 - Read Online
P. 15
Zhang et al. Hepatoma Res 2020;6:30 I http://dx.doi.org/10.20517/2394-5079.2020.17 Page 3 of 16
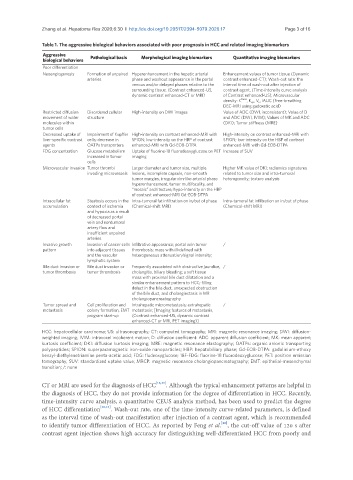
Table 1. The aggressive biological behaviors associated with poor prognosis in HCC and related imaging biomarkers
Aggressive
biological behaviors Pathological basis Morphological imaging biomarkers Quantitative imaging biomarkers
Poor differentiation
Neoangiogenesis Formation of unpaired Hyperenhancement in the hepatic arterial Enhancement values of tumor tissue (Dynamic
arteries phase and washout appearance in the portal contrast enhanced-CT); Wash-out rate: the
venous and/or delayed phases relative to the interval time of wash-out after injection of
surrounding tissue. (Contrast enhanced-US, contrast agent. (Time-intensity curve analysis
dynamic contrast enhanced-CT or MRI) of Contrast enhanced-US); Microvascular
density: K trans , K ep , V e , iAUC (Free-breathing
DEC-MRI using gadoxetic acid)
Restricted diffusion Disordered cellular High-intensity on DWI images Value of ADC (DWI, inconsistent); Value of D
movement of water structure and ADC (DWI, IVIM); Values of MK and ADC
molecules within (DKI); Tumor stiffness (MRE)
tumor cells
Decreased uptake of Impairment of Kupffer High-intensity on contrast enhanced-MRI with High-intensity on contrast enhanced-MRI with
liver-specific contrast cells; decrease in SPION; low-intensity on the HBP of contrast SPION; low-intensity on the HBP of contrast
agents OATPs transporters enhanced-MRI with Gd-EOB-DTPA enhanced-MRI with Gd-EOB-DTPA
FDG concentration Glucose metabolism Uptake of fluorine-18 fluorodeoxyglucose on PET Increase of SUV
increased in tumor imaging
cells
Microvascular invasion Tumor thrombi Larger diameter and tumor size, multiple Higher MK value of DKI; radiomics signatures
invading microvessels lesions, incomplete capsule, non-smooth related to tumor size and intra-tumoral
tumor margins, irregular rim-like arterial phase heterogeneity; texture analysis
hyperenhancement, tumor multifocality, and
“mosaic” architecture; hypo-intensity on the HBP
of contrast enhanced-MRI Gd-EOB-DTPA
Intracellular fat Steatosis occurs in the Intra-tumoral fat infiltration on in/out of phase Intra-tumoral fat infiltration on in/out of phase
accumulation context of ischemia (Chemical-shift MRI) (Chemical-shift MRI)
and hypoxia as a result
of decreased portal
vein and nontumoral
artery flow and
insufficient unpaired
arteries
Invasive growth Invasion of cancer cells Infiltrative appearance; portal vein tumor /
pattern into adjacent tissues thrombosis; mass with ill-defined with
and the vascular heterogeneous attenuation/signal intensity;
lymphatic system
Bile duct invasion or Bile duct invasion or Frequently associated with obstructive jaundice, /
tumor thrombosis tumor thrombosis cholangitis, biliary bleeding; a soft tissue
mass with proximal bile duct dilatation and a
similar enhancement pattern to HCC; filling
defect in the bile duct, unexpected obstruction
of the bile duct, and cholangiectasis in MR
cholangiopancreatography
Tumor spread and Cell proliferation and Intrahepatic micrometastasis; extrahepatic /
metastasis colony formation, EMT metastasis; [Imaging features of metastasis,
program start-up (Contrast enhanced-US, dynamic contrast
enhanced-CT or MRI, PET imaging)]
HCC: hepatocellular carcinoma; US: ultrasonography; CT: computed tomography; MRI: magnetic resonance imaging; DWI: diffusion-
weighted imaging; IVIM: intravoxel incoherent motion; D: diffusion coefficient: ADC: apparent diffusion coefficient; MK: mean apparent
kurtosis coefficient; DKI: diffusion kurtosis imaging; MRE: magnetic resonance elastography; OATPs: organic anionic transporting
polypeptides; SPION: superparamagnetic iron-oxide nanoparticles; HBP: hepatobiliary phase; Gd-EOB-DTPA: gadolinium-ethoxy
benzyl-diethylenetriamine penta-acetic acid; FDG: fludeoxyglucose; 18F-FDG: fluorine-18 fluorodeoxyglucose; PET: positron emission
tomography; SUV: standardized uptake value; MRCP: magnetic resonance cholangiopancreatography; EMT: epithelial-mesenchymal
transition; /: none
CT or MRI are used for the diagnosis of HCC [18,19] . Although the typical enhancement patterns are helpful in
the diagnosis of HCC, they do not provide information for the degree of differentiation in HCC. Recently,
time-intensity curve analysis, a quantitative CEUS analysis method, has been used to predict the degree
of HCC differentiation [20,21] . Wash-out rate, one of the time-intensity curve-related parameters, is defined
as the interval time of wash-out manifestation after injection of a contrast agent, which is recommended
[20]
to identify tumor differentiation of HCC. As reported by Feng et al. , the cut-off value of 120 s after
contrast agent injection shows high accuracy for distinguishing well-differentiated HCC from poorly and