
Page 36 - Read Online
P. 36
Garg et al. Hepatoma Res 2019;5:39 I http://dx.doi.org/10.20517/2394-5079.2019.009 Page 5 of 11
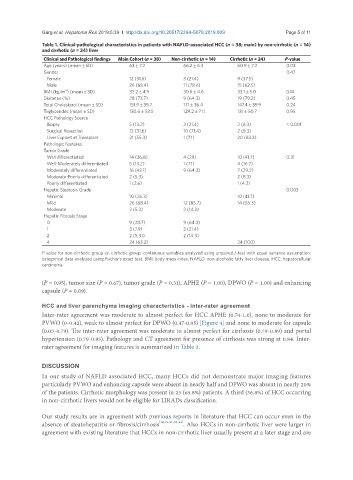
Table 1. Clinical-pathological characteristics in patients with NAFLD-associated HCC (n = 38; main) by non-cirrhotic (n = 14)
and cirrhotic (n = 24) liver
Clinical and Pathological findings Main Cohort (n = 38) Non-cirrhotic (n = 14) Cirrhotic (n = 24) P-value
Age (years) (mean ± SD) 63 ± 7.2 66.2 ± 6.3 60.9 ± 7.2 0.03
Gender 0.47
Female 12 (31.6) 3 (21.4) 9 (37.5)
Male 26 (68.4) 11 (78.6) 15 (62.5)
BMI (kg/m ) (mean ± SD) 32.2 ± 4.9 30.6 ± 4.6 33.1 ± 5.0 0.14
2
Diabetes (%) 28 (73.7) 9 (64.3) 19 (79.2) 0.45
Total Cholesterol (mean ± SD) 151.9 ± 39.7 171 ± 36.4 147.4 ± 39.9 0.24
Triglycerides (mean ± SD) 130.6 ± 53.5 129.2 ± 71.1 131 ± 50.7 0.95
HCC Pathology Source
Biopsy 5 (13.2) 3 (21.4) 2 (8.3) < 0.001
Surgical Resection 12 (31.6) 10 (71.4) 2 (8.3)
Liver Explant at Transplant 21 (55.3) 1 (7.1) 20 (83.3)
Pathologic Features
Tumor Grade
Well differentiated 14 (36.8) 4 (29) 10 (41.7) 0.31
Well-Moderately differentiated 5 (13.2) 1 (7.1) 4 (16.7)
Moderately differentiated 16 (42.1) 9 (64.3) 7 (29.2)
Moderate-Poorly differentiated 2 (5.3) 2 (8.3)
Poorly differentiated 1 (2.6) 1 (4.2)
Hepatic Steatosis Grade 0.003
Minimal 10 (26.3) 10 (41.7)
Mild 26 (68.4) 12 (85.7) 14 (58.3)
Moderate 2 (5.3) 2 (14.3)
Hepatic Fibrosis Stage
0 9 (23.7) 9 (64.3)
1 3 (7.9) 3 (21.4)
2 2 (5.3)) 2 (14.3)
4 24 (63.2) 24 (100)
P-value for non-cirrhotic group vs. cirrhotic group; continuous variables analyzed using unpaired t-test with equal variance assumption;
categorical data analyzed using Fischer’s exact test. BMI: body mass index; NAFLD: non-alcoholic fatty liver disease; HCC: hepatocellular
carcinoma
(P = 0.95), tumor size (P = 0.67), tumor grade (P = 0.31), APHE (P = 1.00), DPWO (P = 1.00) and enhancing
capsule (P = 0.09).
HCC and liver parenchyma imaging characteristics - inter-rater agreement
Inter-rater agreement was moderate to almost perfect for HCC APHE (0.74-1.0), none to moderate for
PVWO (0-0.42), weak to almost perfect for DPWO (0.47-0.95) [Figure 4] and none to moderate for capsule
(0.05-0.79). The inter-rater agreement was moderate to almost perfect for cirrhosis (0.79-0.89) and portal
hypertension (0.79-0.95). Pathology and CT agreement for presence of cirrhosis was strong at 0.84. Inter-
rater agreement for imaging features is summarized in Table 3.
DISCUSSION
In our study of NAFLD associated HCC, many HCCs did not demonstrate major imaging features
particularly PVWO and enhancing capsule were absent in nearly half and DPWO was absent in nearly 20%
of the patients. Cirrhotic morphology was present in 25 (65.8%) patients. A third (36.8%) of HCC occurring
in non-cirrhotic livers would not be eligible for LIRADs classification.
Our study results are in agreement with previous reports in literature that HCC can occur even in the
absence of steatohepatitis or fibrosis/cirrhosis [10,19-21,28-34] . Also HCCs in non-cirrhotic liver were larger in
agreement with existing literature that HCCs in non-cirrhotic liver usually present at a later stage and are