
Page 15 - Read Online
P. 15
Page 10 of 13 Tong et al. Hepatoma Res 2019;5:36 I http://dx.doi.org/10.20517/2394-5079.2019.005
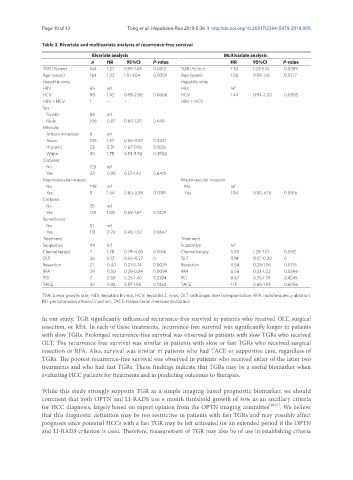
Table 3. Bivariate and multivariate analysis of recurrence-free survival
Bivariate analysis Multivariate analysis
n HR 95%CI P-value HR 95%CI P-value
TGR (%/mo) 164 1.27 0.99-1.63 0.0612 TGR (%/mo) 1.34 1.03-1.74 0.0289
Age (years) 164 1.02 1.01-1.04 0.0059 Age (years) 1.08 0.99-1.18 0.0717
Hepatitis virus Hepatitis virus
HBV 65 ref HBV ref
HCV 98 1.42 0.98-2.06 0.0606 HCV 1.44 0.94-2.20 0.0905
HBV + HCV 1 -- -- HBV + HCV
Sex
Female 58 ref
Male 106 0.87 0.60-1.25 0.449
Ethnicity
African American 6 ref
Asian 105 1.57 0.50-4.97 0.4441
Hispanic 23 2.31 0.67-7.90 0.1826
White 30 1.78 0.53-5.92 0.3502
Diabetes
No 125 ref
Yes 32 0.90 0.57-1.42 0.6410
Macrovascular invasion Macrovascular invasion
No 149 ref No ref
Yes 9 1.64 0.80-3.38 0.1789 Yes 1.94 0.90-4.18 0.0916
Cirrhosis
No 35 ref
Yes 129 1.08 0.69-1.67 0.7429
Surveillance
No 51 ref
Yes 113 0.70 0.48-1.02 0.0647
Treatment Treatment
Supportive 44 ref Supportive ref
Chemotherapy 7 1.78 0.79-4.00 0.1654 Chemotherapy 3.00 1.28-7.01 0.0112
OLT 26 0.13 0.06-0.27 0 OLT 0.14 0.07-0.30 0
Resection 21 0.40 0.21-0.74 0.0039 Resection 0.54 0.28-1.06 0.0716
RFA 29 0.50 0.29-0.84 0.0099 RFA 0.58 0.33-1.02 0.0596
PEI 7 0.59 0.25-1.40 0.2324 PEI 0.67 0.25-1.79 0.4249
TACE 30 0.92 0.57-1.50 0.7464 TACE 1.15 0.68-1.93 0.6056
TGR: tumor growth rate; HBV: hepatitis B virus; HCV: hepatitis C virus; OLT: orthotopic liver transplantation; RFA: radiofrequency ablation;
PEI: percutaneous ethanol injection; TACE: transarterial chemoembolization
In our study, TGR significantly influenced recurrence-free survival in patients who received OLT, surgical
resection, or RFA. In each of these treatments, recurrence-free survival was significantly longer in patients
with slow TGRs. Prolonged recurrence-free survival was observed in patients with slow TGRs who received
OLT. The recurrence-free survival was similar in patients with slow or fast TGRs who received surgical
resection or RFA. Also, survival was similar in patients who had TACE or supportive care, regardless of
TGRs. The poorest recurrence-free survival was observed in patients who received either of the latter two
treatments and who had fast TGRs. These findings indicate that TGRs may be a useful biomarker when
evaluating HCC patients for treatments and in predicting outcomes to therapies.
While this study strongly supports TGR as a simple imaging-based prognostic biomarker, we should
comment that both OPTN and LI-RADS use 6 month threshold growth of 50% as an ancillary criteria
for HCC diagnosis, largely based on expert opinion from the OPTN imaging committee [20,21] . We believe
that this diagnostic definition may be too restrictive in patients with fast TGRs and may possibly affect
prognosis since potential HCCs with a fast TGR may be left untreated for an extended period if the OPTN
and LI-RADS criterion is used. Therefore, measurement of TGR may also be of use in establishing criteria