
Page 11 - Read Online
P. 11
Page 6 of 13 Tong et al. Hepatoma Res 2019;5:36 I http://dx.doi.org/10.20517/2394-5079.2019.005
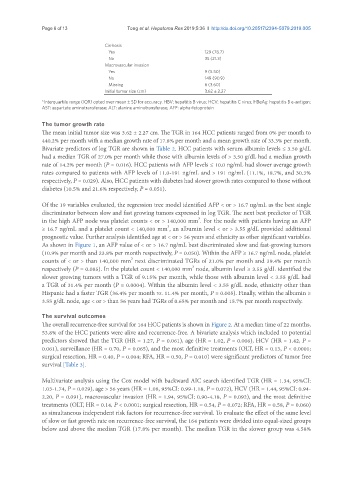
Cirrhosis
Yes 129 (78.7)
No 35 (21.3)
Macrovascular invasion
Yes 9 (5.50)
No 149 (90.9)
Missing 6 (3.60)
Initial tumor size (cm) 3.62 ± 2.27
*Interquartile range (IQR) opted over mean ± SD for accuracy. HBV: hepatitis B virus; HCV: hepatitis C virus; HBeAg: hepatitis B e-antigen;
AST: aspartate aminotransferase; ALT: alanine aminotransferase; AFP: alpha-fetoprotein
The tumor growth rate
The mean initial tumor size was 3.62 ± 2.27 cm. The TGR in 164 HCC patients ranged from 0% per month to
440.2% per month with a median growth rate of 17.8% per month and a mean growth rate of 33.3% per month.
Bivariate predictors of log TGR are shown in Table 2. HCC patients with serum albumin levels ≤ 3.50 g/dL
had a median TGR of 27.0% per month while those with albumin levels of > 3.50 g/dL had a median growth
rate of 14.2% per month (P = 0.016). HCC patients with AFP levels ≤ 10.0 ng/mL had slower average growth
rates compared to patients with AFP levels of 11.0-191 ng/mL and > 191 ng/mL (11.1%, 18.7%, and 30.3%
respectively, P = 0.029). Also, HCC patients with diabetes had slower growth rates compared to those without
diabetes (10.5% and 21.6% respectively, P = 0.051).
Of the 19 variables evaluated, the regression tree model identified AFP < or > 16.7 ng/mL as the best single
discriminator between slow and fast growing tumors expressed in log TGR. The next best predictor of TGR
3
in the high AFP node was platelet counts < or > 140,000 mm . For the node with patients having an AFP
3
≥ 16.7 ng/mL and a platelet count < 140,000 mm , an albumin level < or > 3.55 g/dL provided additional
prognostic value. Further analysis identified age at < or > 56 years and ethnicity as other significant variables.
As shown in Figure 1, an AFP value of < or > 16.7 ng/mL best discriminated slow and fast-growing tumors
(10.9% per month and 23.8% per month respectively, P = 0.050). Within the AFP ≥ 16.7 ng/mL node, platelet
counts of < or > than 140,000 mm next discriminated TGRs of 21.0% per month and 39.4% per month
3
3
respectively (P = 0.085). In the platelet count < 140,000 mm node, albumin level ≥ 3.55 g/dL identified the
slower growing tumors with a TGR of 9.15% per month, while those with albumin level < 3.55 g/dL had
a TGR of 31.4% per month (P = 0.0004). Within the albumin level < 3.55 g/dL node, ethnicity other than
Hispanic had a faster TGR (36.4% per month vs. 11.4% per month, P = 0.005). Finally, within the albumin ≥
3.55 g/dL node, age < or > than 56 years had TGRs of 0.65% per month and 15.7% per month respectively.
The survival outcomes
The overall recurrence-free survival for 164 HCC patients is shown in Figure 2. At a median time of 22 months,
53.8% of the HCC patients were alive and recurrence-free. A bivariate analysis which included 10 potential
predictors showed that the TGR (HR = 1.27, P = 0.061), age (HR = 1.02, P = 0.006), HCV (HR = 1.42, P =
0.061), surveillance (HR = 0.70, P = 0.065), and the most definitive treatments (OLT, HR = 0.13, P < 0.0001;
surgical resection, HR = 0.40, P = 0.004; RFA, HR = 0.50, P = 0.010) were significant predictors of tumor free
survival [Table 3].
Multivariate analysis using the Cox model with backward AIC search identified TGR (HR = 1.34, 95%CI:
1.03-1.74, P = 0.029), age > 56 years (HR = 1.08, 95%CI: 0.99-1.18, P = 0.072), HCV (HR = 1.44, 95%CI: 0.94-
2.20, P = 0.091), macrovascular invasion (HR = 1.94, 95%CI: 0.90-4.18, P = 0.092), and the most definitive
treatments (OLT, HR = 0.14, P < 0.0001; surgical resection, HR = 0.54, P = 0.072; RFA, HR = 0.58, P = 0.060)
as simultaneous independent risk factors for recurrence-free survival. To evaluate the effect of the same level
of slow or fast growth rate on recurrence-free survival, the 164 patients were divided into equal-sized groups
below and above the median TGR (17.8% per month). The median TGR in the slower group was 4.58%