Page 12 - Read Online
P. 12

Tong et al. Hepatoma Res 2019;5:36  I  http://dx.doi.org/10.20517/2394-5079.2019.005                                             Page 7 of 13


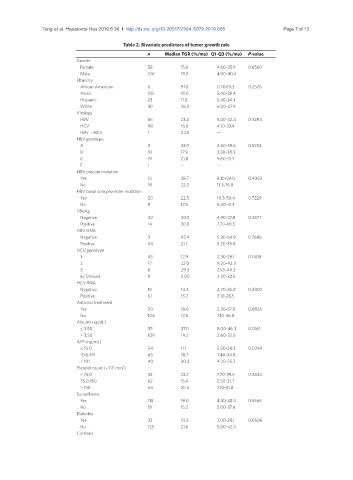
                                           Table 2. Bivariate predictors of tumor growth rate
                                                   n     Median TGR (%/mo) Q1-Q3 (%/mo)  P-value
                           Gender
                            Female                 58         15.6        4.60-35.9  0.6560
                            Male                   106        19.3        4.90-40.4
                           Ethnicity
                            African American       6          9.10        0.70-19.3  0.2526
                            Asian                  105        18.0        5.40-38.4
                            Hispanic               23         11.8        2.40-34.4
                            White                  30         26.3        6.00-47.9
                           Virology
                            HBV                    65         23.2        5.40-42.4  0.3284
                            HCV                    98         16.6        4.10-33.4
                            HBV + HCV              1          2.20        --
                           HBV genotype
                            A                      3          33.0        4.60-59.6  0.5253
                            B                      10         17.9        3.30-38.5
                            C                      19         21.8        9.60-51.7
                            F                      1          --          --
                           HBV precore mutation
                            Yes                    15         28.7        8.10-54.0  0.4053
                            No                     18         22.5        11.3-76.8
                           HBV basal core promoter mutation
                            Yes                    20         22.5        10.3-50.4  0.7229
                            No                     8          17.8        6.30-41.1
                           HBeAg
                            Negative               42         20.5        4.90-37.8  0.3877
                            Positive               14         30.8        7.70-68.5
                           HBV DNA
                            Negative               3          42.4        5.30-64.9  0.7686
                            Positive               54         21.1        5.20-35.6
                           HCV genotype
                            1                      45         12.9        2.30-28.1  0.1408
                            2                      17         22.0        9.20-42.3
                            3                      6          29.3        23.5-44.3
                            6/7/mixed              9          3.00        2.20-32.5
                           HCV RNA
                            Negative               15         14.4        4.70-26.2  0.3802
                            Positive               61         15.2        3.10-28.5
                           Antiviral treatment
                            Yes                    50         18.6        2.30-37.8  0.8826
                            No                     108        17.8        7.10-36.8
                           Albumin (g/dL)
                            ≤ 3.50                 55         27.0        8.00-46.3  0.0161
                            > 3.50                 109        14.2        2.60-32.5
                           AFP (ng/mL)
                            ≤ 10.0                 54         11.1        2.50-28.3  0.0294
                            10.0-191               66         18.7        7.40-34.8
                            > 191                  40         30.3        4.20-75.2
                                       3
                                          3
                           Platelet count (× 10  mm )
                            ≤ 75.0                 34         23.7        7.70-39.5  0.2834
                            75.0-150               62         15.4        2.50-31.7
                            > 150                  64         20.4        7.10-41.8
                           Surveillance
                            Yes                    113        18.0        4.30-38.4  0.5565
                            No                     51         15.2        5.00-37.6
                           Diabetes
                            Yes                    32         10.5        2.00-28.1  0.0506
                            No                     125        21.6        5.60-42.3
                           Cirrhosis
   7   8   9   10   11   12   13   14   15   16   17