Page 189 - Read Online
P. 189

Costa et al. Hepatoma Res 2018;4:35  I  http://dx.doi.org/10.20517/2394-5079.2018.06                                               Page 7 of 11

                A     4.0                                     B    3.5
                    HCC pathologic classification  3.0  P = 0.01  HCC pathologic classification  3.0  P = 0.02
                      3.5


                                                                   2.5
                      2.5
                                                    2
                                                   R  = 0.44
                                                                                                 2
                                                                                                R  = 0.42
                                                                   2.0
                      2.0
                      1.5                                          1.5
                         0                      5                     10                    15  0                2                 4                 6                8
                                                       SUVmax                      SUVmax of tumor and liver ratio
                                       C     4.0
                                           HCC pathologic classification  3.0  P = 0.006
                                             3.5


                                             2.5
                                                                           2
                                                                          R  = 0.54
                                             2.0

                                             1.5
                                                0                5               10              15               20
                                                            SUVmax of tumor and muscle ratio

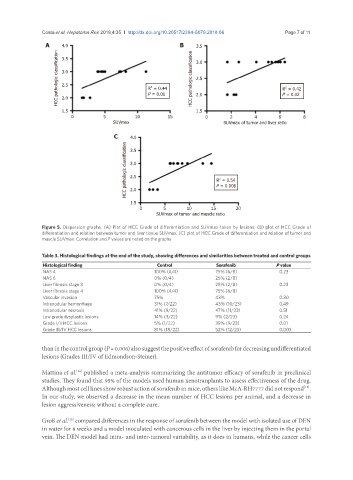
               Figure 5. Dispersion graphs. (A) Plot of HCC Grade of differentiation and SUVmax taken by lesions; (B) plot of HCC Grade of
               differentiation and relation between tumor and liver tissue SUVmax; (C) plot of HCC Grade of differentiation and relation of tumor and
               muscle SUVmax. Correlation and P values are noted on the graphs

               Table 3. Histological findings at the end of the study, showing differences and similarities between treated and control groups
               Histological finding                   Control             Sorafenib           P value
               NAS 4                                 100% (4/4)           75% (6/8)            0.23
               NAS 6                                 0% (0/4)             25% (2/8)
               Liver fibrosis stage 3                0% (0/4)             25% (2/8)            0.23
               Liver fibrosis stage 4                100% (4/4)           75% (6/8)
               Vascular invasion                     75%                  43%                  0.30
               Intranodular hemorrhage               31% (7/22)           43% (10/23)          0.49
               Intranodular necrosis                 41% (9/22)           47% (11/23)          0.51
               Low grade dysplastic lesions          14% (3/22)           9% (2/23)            0.24
               Grade I/II HCC lesions                5% (1/22)            39% (9/23)           0.01
               Grade III/IV HCC lesions              81% (18/22)          52% (12/23)          0.003

               than in the control group (P = 0.006) also suggest the positive effect of sorafenib for decreasing undifferentiated
               lesions (Grades III/IV of Edmondson-Steiner).

               Mattina et al.  published a meta-analysis summarizing the antitumor efficacy of sorafenib in preclinical
                           [36]
               studies. They found that 95% of the models used human xenotranplants to assess effectiveness of the drug.
               Although most cell lines show robust action of sorafenib in mice, others like McA-RH7777 did not respond .
                                                                                                        [12]
               In our study, we observed a decrease in the mean number of HCC lesions per animal, and a decrease in
               lesion aggressiveness; without a complete cure.

               Groß et al.  compared differences in the response of sorafenib between the model with isolated use of DEN
                        [12]
               in water for 8 weeks and a model inoculated with cancerous cells in the liver by injecting them in the portal
               vein. The DEN model had intra- and inter-tumoral variability, as it does in humans, while the cancer cells
   184   185   186   187   188   189   190   191   192   193   194