
Page 186 - Read Online
P. 186
Page 4 of 11 Costa et al. Hepatoma Res 2018;4:35 I http://dx.doi.org/10.20517/2394-5079.2018.06
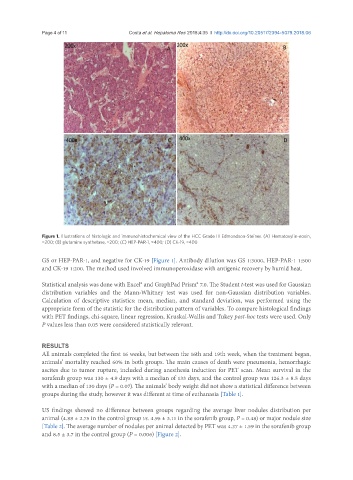
Figure 1. Illustrations of histologic and immunohistochemical view of the HCC Grade III Edmondson-Steiner. (A) Hematoxylin-eosin,
×200; (B) glutamine synthetase, ×200; (C) HEP-PAR-1, ×400; (D) CK-19, ×400
GS or HEP-PAR-1, and negative for CK-19 [Figure 1]. Antibody dilution was GS 1:3000, HEP-PAR-1 1:500
and CK-19 1:200. The method used involved immunoperoxidase with antigenic recovery by humid heat.
Statistical analysis was done with Excel® and GraphPad Prism® 7.0. The Student t-test was used for Gaussian
distribution variables and the Mann-Whitney test was used for non-Gaussian distribution variables.
Calculation of descriptive statistics: mean, median, and standard deviation, was performed using the
appropriate form of the statistic for the distribution pattern of variables. To compare histological findings
with PET findings, chi-square, linear regression, Kruskal-Wallis and Tukey post-hoc tests were used. Only
P values less than 0.05 were considered statistically relevant.
RESULTS
All animals completed the first 16 weeks, but between the 16th and 19th week, when the treatment began,
animals’ mortality reached 60% in both groups. The main causes of death were pneumonia, hemorrhagic
ascites due to tumor rupture, included during anesthesia induction for PET scan. Mean survival in the
sorafenib group was 130 ± 4.9 days with a median of 133 days, and the control group was 126.3 ± 8.5 days
with a median of 130 days (P = 0.07). The animals’ body weight did not show a statistical difference between
groups during the study, however it was different at time of euthanasia [Table 1].
US findings showed no difference between groups regarding the average liver nodules distribution per
animal (4.88 ± 2.75 in the control group vs. 4.95 ± 3.11 in the sorafenib group, P = 0.48) or major nodule size
[Table 2]. The average number of nodules per animal detected by PET was 4.37 ± 1.59 in the sorafenib group
and 8.5 ± 3.7 in the control group (P = 0.006) [Figure 2].