
Page 188 - Read Online
P. 188
Page 6 of 11 Costa et al. Hepatoma Res 2018;4:35 I http://dx.doi.org/10.20517/2394-5079.2018.06
15
P = 0.01
10
SUVmax
5
0
Sorafenib Control
Figure 3. Comparison of SUVmax values between nodules of the control and sorafenib groups
12.00 P = 0.008
10.00
8.00
SUVmax 6.00
4.00
2.00
0.00
II III IV
HCC pathologic classificaion
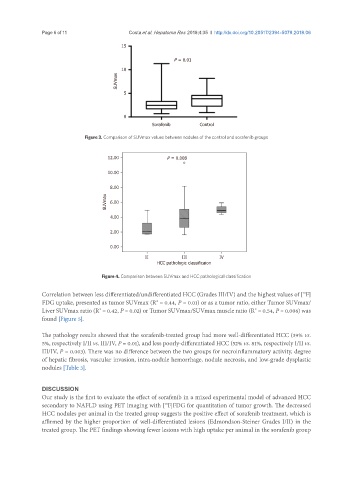
Figure 4. Comparison between SUVmax and HCC pathological classification
Correlation between less differentiated/undifferentiated HCC (Grades III/IV) and the highest values of [ F]
18
FDG uptake, presented as tumor SUVmax (R = 0.44, P = 0.01) or as a tumor ratio, either Tumor SUVmax/
2
Liver SUVmax ratio (R = 0.42, P = 0.02) or Tumor SUVmax/SUVmax muscle ratio (R = 0.54, P = 0.006) was
2
2
found [Figure 5].
The pathology results showed that the sorafenib-treated group had more well-differentiated HCC (39% vs.
5%, respectively I/II vs. III/IV, P = 0.01), and less poorly-differentiated HCC (52% vs. 81%, respectively I/II vs.
III/IV, P = 0.003). There was no difference between the two groups for necroinflammatory activity, degree
of hepatic fibrosis, vascular invasion, intra-nodule hemorrhage, nodule necrosis, and low-grade dysplastic
nodules [Table 3].
DISCUSSION
Our study is the first to evaluate the effect of sorafenib in a mixed experimental model of advanced HCC
secondary to NAFLD using PET imaging with [ F]FDG for quantitation of tumor growth. The decreased
18
HCC nodules per animal in the treated group suggests the positive effect of sorafenib treatment, which is
affirmed by the higher proportion of well-differentiated lesions (Edmondson-Steiner Grades I/II) in the
treated group. The PET findings showing fewer lesions with high uptake per animal in the sorafenib group