
Page 187 - Read Online
P. 187
Costa et al. Hepatoma Res 2018;4:35 I http://dx.doi.org/10.20517/2394-5079.2018.06 Page 5 of 11
Table 1. Weight evolution according to studied groups
Weight (g) Control average Sorafenib average P value
(n = 10) (n = 20)
16th week 479.5 ± 45.4 463 ± 46.2 0.28
19th week 440.5 ± 67 420 ± 34.4 0.24
Euthanasia 486.3 ± 38 394 ± 48.5 0.003
Liver weight 35 ± 4.6 27.5 ± 11.6 0.13
Table 2. The sonographic findings at the 16th week of experimentation before treatment with sorafenib or placebo
Liver US 16th week Control (n = 10) Sorafenib (n = 20) P value
Major nodule (cm) 1.04 ± 0.69 0.72 ± 0.92 0.34
Median of nodules per animal 5 5
Average of nodules per animal 4.88 ± 2.75 4.95 ± 3.11 0.48
Quantity of nodules 44 99
Percent of nodules in the left/medium lobes 75 61 0.14
Percent of nodules in the right/caudate lobes 25 39 0.22
Percent of ascites 11 10 0.46
18
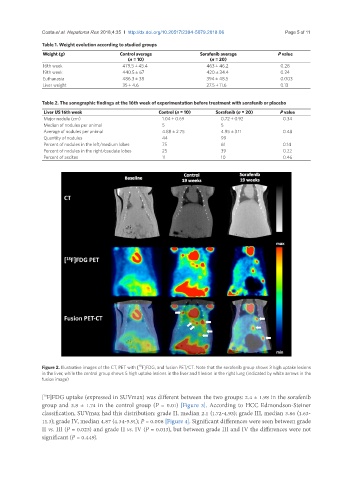
Figure 2. Illustrative images of the CT, PET with [ F]FDG, and fusion PET/CT. Note that the sorafenib group shows 3 high uptake lesions
in the liver, while the control group shows 5 high uptake lesions in the liver and 1 lesion in the right lung (indicated by white arrows in the
fusion image)
18
[ F]FDG uptake (expressed in SUVmax) was different between the two groups: 2.4 ± 1.98 in the sorafenib
group and 3.8 ± 1.74 in the control group (P = 0.01) [Figure 3]. According to HCC Edmondson-Steiner
classification, SUVmax had this distribution: grade II, median 2.1 (1.72-4.93); grade III, median 3.86 (1.63-
11.3); grade IV, median 4.87 (4.34-5.91); P = 0.008 [Figure 4]. Significant differences were seen between grade
II vs. III (P = 0.023) and grade II vs. IV (P = 0.013), but between grade III and IV the differences were not
significant (P = 0.449).