
Page 10 - Read Online
P. 10
Lv et al. Energy Mater 2024;4:400018 https://dx.doi.org/10.20517/energymater.2023.90 Page 5 of 11
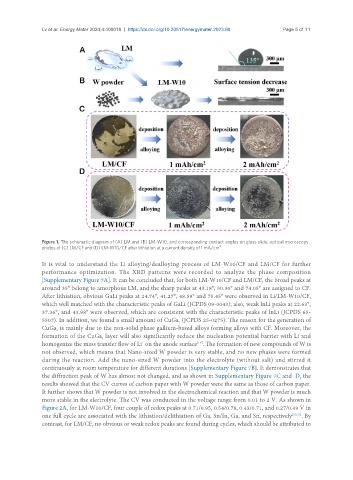
Figure 1. The schematic diagram of (A) LM and (B) LM-W10, and corresponding contact angles on glass slide; optical microscopy
photos of (C) LM/CF and (D) LM-W10/CF after lithiation at a current density of 1 mA/cm . 2
It is vital to understand the Li alloying/dealloying process of LM-W10/CF and LM/CF for further
performance optimization. The XRD patterns were recorded to analyze the phase composition
[Supplementary Figure 7A]. It can be concluded that, for both LM-W10/CF and LM/CF, the broad peaks at
around 35° belong to amorphous LM, and the sharp peaks at 43.18°, 50.30° and 74.05° are assigned to CF.
After lithiation, obvious GaLi peaks at 24.74°, 41.27°, 48.59° and 75.45° were observed in Li/LM-W10/CF,
which well matched with the characteristic peaks of GaLi (JCPDS 09-0043); also, weak lnLi peaks at 22.63°,
37.36°, and 43.98° were observed, which are consistent with the characteristic peaks of lnLi (JCPDS 65-
5507). In addition, we found a small amount of CuGa (JCPDS 25-0275). The reason for the generation of
2
CuGa is mainly due to the non-solid phase gallium-based alloys forming alloys with CF. Moreover, the
2
formation of the CuGa layer will also significantly reduce the nucleation potential barrier with Li and
2
homogenize the mass transfer flow of Li on the anode surface . The formation of new compounds of W is
[19]
+
not observed, which means that Nano-sized W powder is very stable, and no new phases were formed
during the reaction. Add the nano-sized W powder into the electrolyte (without salt) and stirred it
continuously at room temperature for different durations [Supplementary Figure 7B]. It demonstrates that
the diffraction peak of W has almost not changed, and as shown in Supplementary Figure 7C and D, the
results showed that the CV curves of carbon paper with W powder were the same as those of carbon paper.
It further shows that W powder is not involved in the electrochemical reaction and that W powder is much
more stable in the electrolyte. The CV was conducted in the voltage range from 0.01 to 2 V. As shown in
Figure 2A, for LM-W10/CF, four couple of redox peaks at 0.71/0.95, 0.54/0.78, 0.43/0.71, and 0.27/0.49 V in
one full cycle are associated with the lithiation/delithiation of Ga, Sn/In, Ga, and Sn, respectively [30,31] . By
contrast, for LM/CF, no obvious or weak redox peaks are found during cycles, which should be attributed to