
Page 10 - Read Online
P. 10
Page 6 of 11 Chen et al. Energy Mater 2022;2:200033 https://dx.doi.org/10.20517/energymater.2022.36
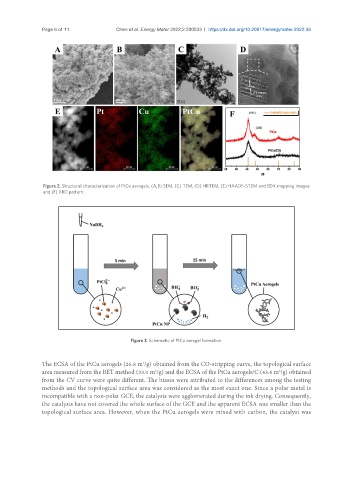
Figure 2. Structural characterization of PtCu aerogels. (A,B) SEM, (C) TEM, (D) HRTEM, (E) HAADF-STEM and EDX mapping images
and (F) XRD pattern.
Figure 3. Schematic of PtCu aerogel formation.
2
The ECSA of the PtCu aerogels (26.8 m /g) obtained from the CO-stripping curve, the topological surface
area measured from the BET method (33.0 m /g) and the ECSA of the PtCu aerogels/C (43.6 m /g) obtained
2
2
from the CV curve were quite different. The biases were attributed to the differences among the testing
methods and the topological surface area was considered as the most exact one. Since a polar metal is
incompatible with a non-polar GCE, the catalysts were agglomerated during the ink drying. Consequently,
the catalysts have not covered the whole surface of the GCE and the apparent ECSA was smaller than the
topological surface area. However, when the PtCu aerogels were mixed with carbon, the catalyst was