
Page 160 - Read Online
P. 160
Page 8 of 16 Kodag et al. Dis Prev Res 2023;2:12 https://dx.doi.org/10.20517/dpr.2023.11
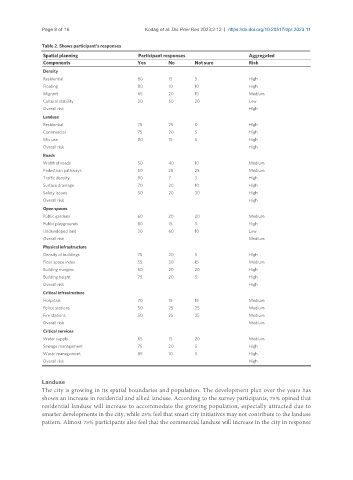
Table 2. Shows participant’s responses
Spatial planning Participant responses Aggregated
Components Yes No Not sure Risk
Density
Residential 80 15 5 High
Floating 80 10 10 High
Migrant 65 20 15 Medium
Cultural stability 30 50 20 Low
Overall risk High
Landuse
Residential 75 25 0 High
Commercial 75 20 5 High
Mix use 80 15 5 High
Overall risk High
Roads
Width of roads 50 40 10 Medium
Pedestrian pathways 50 25 25 Medium
Traffic density 90 7 3 High
Surface drainage 70 20 10 High
Safety issues 50 20 30 High
Overall risk High
Open spaces
Public gardens 60 20 20 Medium
Public playgrounds 80 15 5 High
Undeveloped land 30 60 10 Low
Overall risk Medium
Physical infrastructure
Density of buildings 75 20 5 High
Floor space index 55 30 15 Medium
Building margins 60 20 20 High
Building height 75 20 5 High
Overall risk High
Critical infrastructure
Hospitals 70 15 15 Medium
Police stations 50 25 25 Medium
Fire stations 50 25 25 Medium
Overall risk Medium
Critical services
Water supply 65 15 20 Medium
Sewage management 75 20 5 High
Waste management 85 10 5 High
Overall risk High
Landuse
The city is growing in its spatial boundaries and population. The development plan over the years has
shown an increase in residential and allied landuse. According to the survey participants, 75% opined that
residential landuse will increase to accommodate the growing population, especially attracted due to
smarter developments in the city, while 25% feel that smart city initiatives may not contribute to the landuse
pattern. Almost 75% participants also feel that the commercial landuse will increase in the city in response