


Page 17 - Read online
P. 17
Maffia et al. Carbon Footprints 2026, 5, 7                                       Page 13 of 19


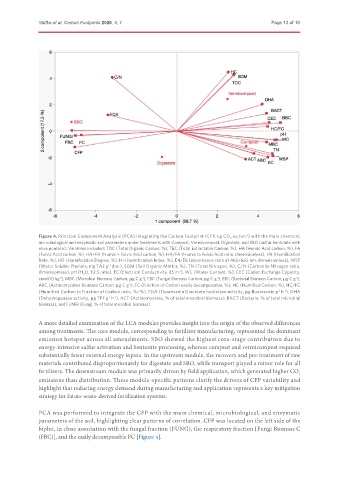
               Figure 4. Principal Component Analysis (PCA) integrating the Carbon Footprint (CFP, kg CO 2  eq ton ) with the main chemical,
                                                                                       -1
               microbiological and enzymatic soil parameters under treatments with Compost, Vermicompost, Digestate, and SBO (sulfur bentonite with
               olive pomace). Variables included: TOC (Total Organic Carbon, %), TEC (Total Extractable Carbon, %), HA (Humic Acid carbon, %), FA
               (Fulvic Acid carbon, %), HA+FA (Humic + Fulvic Acid carbon, %), HA/FA (Humic to Fulvic Acid ratio, dimensionless), HR (Humification
               Rate, %), HD (Humification Degree, %), HI (Humification Index, %), E4/E6 (absorbance ratio at 465/665 nm, dimensionless), WSP
               (Water Soluble Phenols, mg TAE g  d.w.), SOM (Soil Organic Matter, %), TN (Total Nitrogen, %), C/N (Carbon to Nitrogen ratio,
                                       -1
               dimensionless), pH (H 2 O, 1:2.5 ratio), EC (Electrical Conductivity, dS m ), WC (Water Content, %), CEC [Cation Exchange Capacity,
                                                                -1
               cmol(+) kg ], MBC (Microbial Biomass Carbon, µg C g ), FBC (Fungal Biomass Carbon, µg C g ), BBC (Bacterial Biomass Carbon, µg C g ),
                                                                             -1
                                                                                                         -1
                                                   -1
                      -1
               ABC (Actinomycetes Biomass Carbon, µg C g ), FC (Fraction of Carbon easily decomposable, %), HC (Humified Carbon, %), HC/FC
                                              -1
                                                                                                     -1
               (Humified Carbon to Fraction of Carbon ratio, %/%), FDA (Fluorescein Diacetate hydrolase activity, µg fluorescein g  h ), DHA
                                                                                                   -1
               (Dehydrogenase activity, µg TPF g  h ), ACT (Actinomycetes, % of total microbial biomass), BACT (Bacteria, % of total microbial
                                         -1
                                       -1
               biomass), and FUNGI (Fungi, % of total microbial biomass).
               A more detailed examination of the LCA modules provides insight into the origin of the observed differences
               among treatments. The core module, corresponding to fertilizer manufacturing, represented the dominant
               emission hotspot across all amendments. SBO showed the highest core-stage contribution due to
               energy-intensive sulfur activation and bentonite processing, whereas compost and vermicompost required
               substantially fewer external energy inputs. In the upstream module, the recovery and pre-treatment of raw
               materials contributed disproportionately for digestate and SBO, while transport played a minor role for all
               fertilizers. The downstream module was primarily driven by field application, which generated higher CO 2
               emissions than distribution. These module-specific patterns clarify the drivers of CFP variability and
               highlight that reducing energy demand during manufacturing and application represents a key mitigation
               strategy for future waste-derived fertilization systems.

               PCA was performed to integrate the CFP with the main chemical, microbiological, and enzymatic
               parameters of the soil, highlighting clear patterns of correlation. CFP was located on the left side of the
               biplot, in close association with the fungal fraction (FUNG), the respiratory fraction [Fungi Biomass C
               (FBC)], and the easily decomposable FC [Figure 4].

