


Page 93 - Read Online
P. 93
Yu et al. Carbon Footprints 2025, 4, 17  https://dx.doi.org/10.20517/cf.2025.12  Page 9 of 23


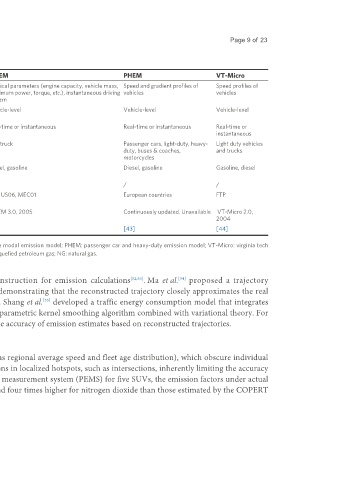
 Table 3. The comparison of MOVES, IVE, CMEM, PHEM and VT-Micro models

 Model  MOVES  IVE  CMEM                   PHEM                           VT-Micro

 Input  Vehicle operation mode, vehicle fleet   Vehicle operation mode, vehicle fleet   Physical parameters (engine capacity, vehicle mass,  Speed and gradient profiles of  Speed profiles of
 composition, vehicle activity,  weather   composition, vehicle activity,  weather   maximum power, torque, etc.), instantaneous driving  vehicles  vehicles
 conditions, etc.  conditions, etc.  pattern

 Spatial   National, regional, project level  National, regional, local, link  Vehicle-level  Vehicle-level  Vehicle-level
 scale
 Time scale Hour, day, week, month, year  Hour, day, week, month, year  Real-time or instantaneous  Real-time or instantaneous  Real-time or
                                                                          instantaneous
 Vehicle   Passenger cars, trucks, buses, motorcycles,  Bus, truck, small engine, motorcycle  Car, truck  Passenger cars, light-duty, heavy-  Light duty vehicles
 type  motorhomes                          duty, buses & coaches,         and trucks
                                           motorcycles
 Energy   Gasoline, diesel, CNG, LPG, electricity,   Gasoline, diesel, NG, ethanol, propane,   Diesel, gasoline  Diesel, gasoline  Gasoline, diesel
 type  ethanol (E85)  CNG and LPG
 Road type Rural, urban  /  /              /                              /
 Driving   Different counties  Developing countries  FTP, US06, MEC01  European countries  FTP
 cycle
 Version   MOVES 5.0.0, 2024   IVE 2007  CMEM 3.0, 2005  Continuously updated. Unavailable   VT-Micro 2.0,
                                                                          2004
 Reference  [40]  [41]  [42]               [43]                           [44]

 MOVES: Motor vehicle emission simulator; IVE: international vehicle emissions; CMEM: comprehensive modal emission model; PHEM: passenger car and heavy-duty emission model; VT-Micro: virginia tech
 microscopic energy and emission model; FTP: federal test procedure; CNG: compressed natural gas; LPG: liquefied petroleum gas; NG: natural gas.


 researchers have increasingly focused on the problem of trajectory reconstruction for emission calculations [52,53] . Ma et al.  proposed a trajectory
                                                             [54]
 reconstruction method based on interpolation of acceleration distributions, demonstrating that the reconstructed trajectory closely approximates the real
 trajectory, achieving 2% to 17% higher accuracy compared to other methods. Shang et al.  developed a traffic energy consumption model that integrates
               [55]
 macroscopic and microscopic data, and reconstructed trajectories using a nonparametric kernel smoothing algorithm combined with variational theory. For
 data with varying sampling frequencies, this approach significantly improved the accuracy of emission estimates based on reconstructed trajectories.


 Accuracy
 Macroscopic and mesoscopic emission models rely on aggregated data (such as regional average speed and fleet age distribution), which obscure individual
 driving heterogeneity. This simplification can lead to the smoothing of emissions in localized hotspots, such as intersections, inherently limiting the accuracy

 of these models. Smit et al.  found that based on data from portable emission measurement system (PEMS) for five SUVs, the emission factors under actual
 [56]
 urban hot operating conditions were seven times higher for nitrogen oxides and four times higher for nitrogen dioxide than those estimated by the COPERT
 model in Australia.

