


Page 88 - Read Online
P. 88
Yu et al. Carbon Footprints 2025, 4, 17  https://dx.doi.org/10.20517/cf.2025.12  Page 5 of 23

               Table 1. A sample of the top 10 terms with high scores from the NLP model
                Keywords                                                             Score
                Estimate road traffic                                                0.0052
                Accurately estimate road                                             0.0076
                Global greenhouse gas                                                0.0101
                Road traffic                                                         0.0116
                Formulate effective emission                                         0.0221
                Estimate road                                                        0.0332
                Carbon dioxide                                                       0.0397
                Greenhouse gas                                                       0.0436
                Emission reduction policies                                          0.0451
                Effective emission reduction                                         0.0453

               NLP: Natural language processing.


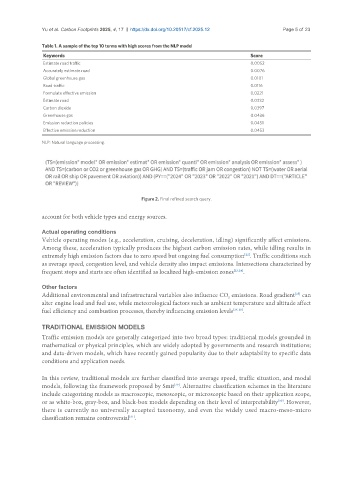
                                                 Figure 2. Final refined search query.

               account for both vehicle types and energy sources.

               Actual operating conditions
               Vehicle operating modes (e.g., acceleration, cruising, deceleration, idling) significantly affect emissions.
               Among these, acceleration typically produces the highest carbon emission rates, while idling results in
               extremely high emission factors due to zero speed but ongoing fuel consumption . Traffic conditions such
                                                                                   [22]
               as average speed, congestion level, and vehicle density also impact emissions. Intersections characterized by
               frequent stops and starts are often identified as localized high-emission zones [23,24] .


               Other factors
               Additional environmental and infrastructural variables also influence CO  emissions. Road gradient  can
                                                                                                    [25]
                                                                              2
               alter engine load and fuel use, while meteorological factors such as ambient temperature and altitude affect
               fuel efficiency and combustion processes, thereby influencing emission levels [26-28] .

               TRADITIONAL EMISSION MODELS
               Traffic emission models are generally categorized into two broad types: traditional models grounded in
               mathematical or physical principles, which are widely adopted by governments and research institutions;
               and data-driven models, which have recently gained popularity due to their adaptability to specific data
               conditions and application needs.


               In this review, traditional models are further classified into average speed, traffic situation, and modal
               models, following the framework proposed by Smit . Alternative classification schemes in the literature
                                                            [29]
               include categorizing models as macroscopic, mesoscopic, or microscopic based on their application scope,
               or as white-box, gray-box, and black-box models depending on their level of interpretability . However,
                                                                                               [30]
               there is currently no universally accepted taxonomy, and even the widely used macro-meso-micro
                                             [31]
               classification remains controversial .

