


Page 87 - Read Online
P. 87
Page 4 of 23                      Yu et al. Carbon Footprints 2025, 4, 17  https://dx.doi.org/10.20517/cf.2025.12


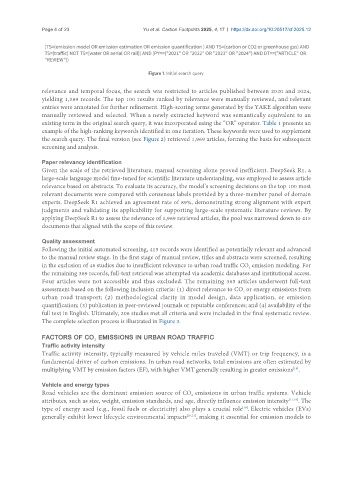
                                                   Figure 1. Initial search query.

               relevance and temporal focus, the search was restricted to articles published between 2020 and 2024,
               yielding 1,389 records. The top 100 results ranked by relevance were manually reviewed, and relevant
               entries were annotated for further refinement. High-scoring terms generated by the YAKE algorithm were
               manually reviewed and selected. When a newly extracted keyword was semantically equivalent to an
               existing term in the original search query, it was incorporated using the “OR” operator. Table 1 presents an
               example of the high-ranking keywords identified in one iteration. These keywords were used to supplement
               the search query. The final version (see Figure 2) retrieved 1,969 articles, forming the basis for subsequent
               screening and analysis.


               Paper relevancy identification
               Given the scale of the retrieved literature, manual screening alone proved inefficient. DeepSeek R1, a
               large-scale language model fine-tuned for scientific literature understanding, was employed to assess article
               relevance based on abstracts. To evaluate its accuracy, the model’s screening decisions on the top 100 most
               relevant documents were compared with consensus labels provided by a three-member panel of domain
               experts. DeepSeek R1 achieved an agreement rate of 89%, demonstrating strong alignment with expert
               judgments and validating its applicability for supporting large-scale systematic literature reviews. By
               applying DeepSeek R1 to assess the relevance of 1,969 retrieved articles, the pool was narrowed down to 415
               documents that aligned with the scope of this review.

               Quality assessment
               Following the initial automated screening, 415 records were identified as potentially relevant and advanced
               to the manual review stage. In the first stage of manual review, titles and abstracts were screened, resulting
               in the exclusion of 46 studies due to insufficient relevance to urban road traffic CO  emission modeling. For
                                                                                     2
               the remaining 369 records, full-text retrieval was attempted via academic databases and institutional access.
               Four articles were not accessible and thus excluded. The remaining 365 articles underwent full-text
               assessment based on the following inclusion criteria: (1) direct relevance to CO  or energy emissions from
                                                                                   2
               urban road transport; (2) methodological clarity in model design, data application, or emission
               quantification; (3) publication in peer-reviewed journals or reputable conferences; and (4) availability of the
               full text in English. Ultimately, 206 studies met all criteria and were included in the final systematic review.
               The complete selection process is illustrated in Figure 3.

               FACTORS OF CO  EMISSIONS IN URBAN ROAD TRAFFIC
                                 2
               Traffic activity intensity
               Traffic activity intensity, typically measured by vehicle miles traveled (VMT) or trip frequency, is a
               fundamental driver of carbon emissions. In urban road networks, total emissions are often estimated by
                                                                                                    [16]
               multiplying VMT by emission factors (EF), with higher VMT generally resulting in greater emissions .
               Vehicle and energy types
               Road vehicles are the dominant emission source of CO  emissions in urban traffic systems. Vehicle
                                                                  2
               attributes, such as size, weight, emission standards, and age, directly influence emission intensity [17,18] . The
               type of energy used (e.g., fossil fuels or electricity) also plays a crucial role . Electric vehicles (EVs)
                                                                                   [19]
               generally exhibit lower lifecycle environmental impacts [20,21] , making it essential for emission models to

