
Page 166 - Read Online
P. 166
Page 530 Belizario et al. Cancer Drug Resist 2019;2:527-38 I http://dx.doi.org/10.20517/cdr.2018.009
[30]
ErbB2/ERBB2) . A high resolution copy-number analyses have confirmed recurrent amplification
on chromosomal regions and genes, respectively, found in primary tumors mapping at 8q24 [v-myc
myelocytomatosis viral oncogene homolog (avian) (MYC)], 11q13 [cyclin D1 (CCND1)], 17q12 (ERBB2),
20q13 [serine/threonine kinase 15 (STK15)/aurora kinase A], and homozygous deletion at 9p21 [cyclin
[32]
dependent kinase inhibitor 2A (CDKN2A)] . Tumors lacking expression of all three receptors (ER, PR,
HER2) are referred to as triple-negative breast cancers (TNBCs), which are tumors most often derived
from cells of basal origin. TNBCs display stem cell-like and luminal progenitor-like gene signatures, and
frequently have somatic mutations in the TSGs TP53 and PTEN, and a smaller fraction is also mutant for
breast cancer 1 (BRCA1). Molecular gene expression profiling has also redefined breast cancer subtypes
as luminal A, luminal B, HER2-rich, and basal-like, which roughly parallel the immune-histochemical
categories [33-35] . The basal and claudin-low subtypes map to the previously designated basal A, and
basal B subtypes, respectively . In general, the luminal A breast cancer subtype displays mutations in
[36]
phosphatidylinositol 3-kinase (PIK3CA) (~49%), mitogen-activated protein kinase (MAP3K1) (~14%), GATA
binding factor 3 (14%), TP53 (~12%), and MAP2K4 (~12%) and loss of Phosphatase and tensin homolog
deleted on chromosome ten (PTEN) (13%), among others. The luminal B breast cancer subtype has
mutations in TP53 (~32%), PIK3CA (~32%), MAP3K1 (~5%) and other genes. HER2-overexpressing tumors
display representative TP53 mutation and overexpression of other genes, such as growth factor receptor-
bound protein 7 (GRB7) and Post-GPI Attachment To Proteins 3. Patients with HER2-overexpressing tumors
usually develop brain metastases and additional mutations in fibroblast growth factor receptor 2, PI3KCA
and ataxia telangiectasia and rad3-related kinase, homozygous deletion in CDKN2A as well as amplification
in Kirsten rat sarcoma viral oncogene homolog (KRAS) [33-36] . Breast cancer patients with BRCA1 germline
mutation do not express ER, PR, and HER2 and share morphological, clinical, and molecular features and
immunohistochemical and cytokeratin expression patterns like basal like breast cancers [30,37] .
Immunohistochemistry and/or fluorescence in situ hybridization in slides or tissue microarray (TMA) have
[30]
been used to identify the distinct primary and invasive and non-invasive breast cancer subtypes . The
subtyping is critical in clinical management of distinct prognoses and predictive responses to endocrine
or targeted therapy [38,39] . Breast cancers with HER2/ERBB amplification respond to trastuzumab and/or
lapatinib, and tumors with mutated or amplified BCR-ABL (breakpoint cluster region C-ABL oncogene
[40]
1, non-receptor tyrosine kinase) respond to imatinib mesylate . However, although molecular profiling
provides important prognostic indicators, breast cancer risk stratification remains a challenge in TNBC
[41]
cases . For instance, the claudin-low subtype was identified as a TNBC subset that is associated with more
[41]
aggressive tumor behavior and worse prognosis .
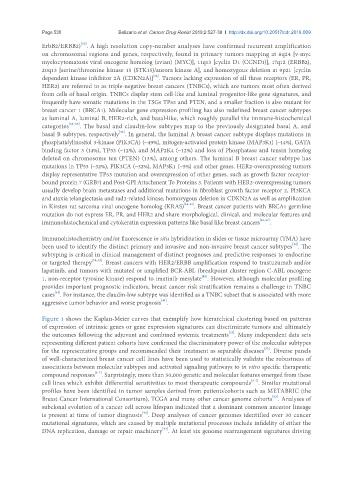
Figure 1 shows the Kaplan-Meier curves that exemplify how hierarchical clustering based on patterns
of expression of intrinsic genes or gene expression signatures can discriminate tumors and ultimately
[33]
the outcomes following the adjuvant and combined systemic treatments . Many independent data sets
representing different patient cohorts have confirmed the discriminatory power of the molecular subtypes
[33]
for the representative groups and recommended their treatment as separable diseases . Diverse panels
of well-characterized breast cancer cell lines have been used to statistically validate the robustness of
associations between molecular subtypes and activated signaling pathways to in vitro specific therapeutic
compound responses . Surprisingly, more than 50,000 genetic and molecular features emerged from these
[5-7]
[5-7]
cell lines which exhibit differential sensitivities to most therapeutic compounds . Similar mutational
profiles have been identified in tumor samples derived from patients’cohorts such as METABRIC (the
[42]
Breast Cancer International Consortium), TCGA and many other cancer genome cohorts . Analyses of
subclonal evolution of a cancer cell across lifespan indicated that a dominant common ancestor lineage
[43]
is present at time of tumor diagnosis . Deep analyses of cancer genomes identified over 30 cancer
mutational signatures, which are caused by multiple mutational processes include infidelity of either the
[43]
DNA replication, damage or repair machinery . At least six genome rearrangement signatures driving