
Page 120 - Read Online
P. 120
Page 775 Wong et al. Cancer Drug Resist 2023;6:768-87 https://dx.doi.org/10.20517/cdr.2023.58
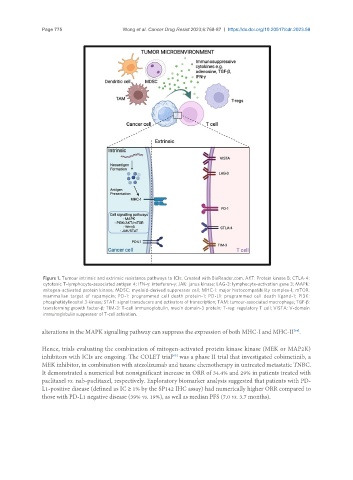
Figure 1. Tumour intrinsic and extrinsic resistance pathways to ICIs. Created with BioRender.com. AKT: Protein kinase B; CTLA-4:
cytotoxic T-lymphocyte-associated antigen 4; IFN-γ: interferon-γ; JAK: janus kinase; LAG-3: lymphocyte-activation gene 3; MAPK:
mitogen-activated protein kinase; MDSC: myeloid-derived suppressor cell; MHC-I: major histocompatibility complex-I; mTOR:
mammalian target of rapamycin; PD-1: programmed cell death protein-1; PD-L1: programmed cell death ligand-1; PI3K:
phosphatidylinositol 3-kinase; STAT: signal transducers and activators of transcription; TAM: tumour-associated macrophage; TGF-β:
transforming growth factor-β; TIM-3: T-cell immunoglobulin, mucin domain-3 protein; T-reg: regulatory T cell; VISTA: V-domain
immunoglobulin suppressor of T-cell activation.
alterations in the MAPK signalling pathway can suppress the expression of both MHC-I and MHC-II .
[64]
Hence, trials evaluating the combination of mitogen-activated protein kinase kinase (MEK or MAP2K)
inhibitors with ICIs are ongoing. The COLET trial was a phase II trial that investigated cobimetinib, a
[65]
MEK inhibitor, in combination with atezolizumab and taxane chemotherapy in untreated metastatic TNBC.
It demonstrated a numerical but nonsignificant increase in ORR of 34.4% and 29% in patients treated with
paclitaxel vs. nab-paclitaxel, respectively. Exploratory biomarker analysis suggested that patients with PD-
L1-positive disease (defined as IC ≥ 1% by the SP142 IHC assay) had numerically higher ORR compared to
those with PD-L1 negative disease (39% vs. 19%), as well as median PFS (7.0 vs. 3.7 months).