


Page 69 - Read Online
P. 69
Page 483                          Bala et al. Art Int Surg. 2025;5:476-89  https://dx.doi.org/10.20517/ais.2025.44

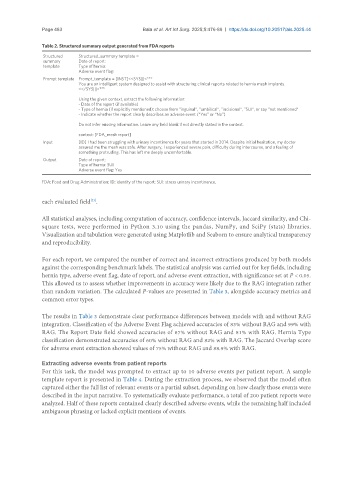
               Table 2. Structured summary output generated from FDA reports

                Structured   Structured_summary template =
                summary     Date of report:
                template    Type of hernia:
                            Adverse event flag:
                Prompt template Prompt_template = [INST]<<SYS|||<***
                            You are an intelligent system designed to assist with structuring clinical reports related to hernia mesh implants.
                            <</SYS|||<***

                            Using the given context, extract the following information:
                            - Date of the report (if available)
                            - Type of hernia (if explicitly mentioned): choose from “inguinal”, “umbilical”, “incisional”, “SUI”, or say “not mentioned”
                            - Indicate whether the report clearly describes an adverse event (“Yes” or “No”)

                            Do not infer missing information. Leave any field blank if not directly stated in the context.

                            context: [FDA_mesh report]
                Input       [ID] I had been struggling with urinary incontinence for years that started in 2014. Despite initial hesitation, my doctor
                            assured me the mesh was safe. After surgery, I experienced severe pain, difficulty during intercourse, and a feeling of
                            something protruding. This has left me deeply uncomfortable.
                Output      Date of report:
                            Type of hernia: SUI
                            Adverse event flag: Yes

               FDA: Food and Drug Administration; ID: identity of the report; SUI: stress urinary incontinence.


               each evaluated field .
                                [33]
               All statistical analyses, including computation of accuracy, confidence intervals, Jaccard similarity, and Chi-
               square tests, were performed in Python 3.10 using the pandas, NumPy, and SciPy (stats) libraries.
               Visualization and tabulation were generated using Matplotlib and Seaborn to ensure analytical transparency
               and reproducibility.


               For each report, we compared the number of correct and incorrect extractions produced by both models
               against the corresponding benchmark labels. The statistical analysis was carried out for key fields, including
               hernia type, adverse event flag, date of report, and adverse event extraction, with significance set at P < 0.05.
               This allowed us to assess whether improvements in accuracy were likely due to the RAG integration rather
               than random variation. The calculated P-values are presented in Table 3, alongside accuracy metrics and
               common error types.


               The results in Table 3 demonstrate clear performance differences between models with and without RAG
               integration. Classification of the Adverse Event Flag achieved accuracies of 83% without RAG and 99% with
               RAG. The Report Date field showed accuracies of 67% without RAG and 81% with RAG. Hernia Type
               classification demonstrated accuracies of 60% without RAG and 82% with RAG. The Jaccard Overlap score
               for adverse event extraction showed values of 75% without RAG and 88.9% with RAG.


               Extracting adverse events from patient reports
               For this task, the model was prompted to extract up to 10 adverse events per patient report. A sample
               template report is presented in Table 4. During the extraction process, we observed that the model often
               captured either the full list of relevant events or a partial subset, depending on how clearly those events were
               described in the input narrative. To systematically evaluate performance, a total of 200 patient reports were
               analyzed. Half of these reports contained clearly described adverse events, while the remaining half included
               ambiguous phrasing or lacked explicit mentions of events.

