
Page 76 - Read Online
P. 76
Page 406 Johnson et al. Art Int Surg 2024;4:401-10 https://dx.doi.org/10.20517/ais.2024.40
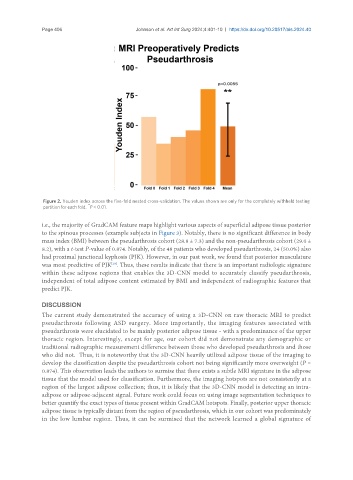
Figure 2. Youden index across the five-fold nested cross-validation. The values shown are only for the completely withheld testing
**
partition for each fold. P < 0.01.
i.e., the majority of GradCAM feature maps highlight various aspects of superficial adipose tissue posterior
to the spinous processes (example subjects in Figure 3). Notably, there is no significant difference in body
mass index (BMI) between the pseudarthrosis cohort (28.8 ± 7.3) and the non-pseudarthrosis cohort (29.0 ±
8.2), with a t-test P-value of 0.874. Notably, of the 48 patients who developed pseudarthrosis, 24 (50.0%) also
had proximal junctional kyphosis (PJK). However, in our past work, we found that posterior musculature
was most predictive of PJK . Thus, these results indicate that there is an important radiologic signature
[18]
within these adipose regions that enables the 3D-CNN model to accurately classify pseudarthrosis,
independent of total adipose content estimated by BMI and independent of radiographic features that
predict PJK.
DISCUSSION
The current study demonstrated the accuracy of using a 3D-CNN on raw thoracic MRI to predict
pseudarthrosis following ASD surgery. More importantly, the imaging features associated with
pseudarthrosis were elucidated to be mainly posterior adipose tissue - with a predominance of the upper
thoracic region. Interestingly, except for age, our cohort did not demonstrate any demographic or
traditional radiographic measurement difference between those who developed pseudarthrosis and those
who did not. Thus, it is noteworthy that the 3D-CNN heavily utilized adipose tissue of the imaging to
develop the classification despite the pseudarthrosis cohort not being significantly more overweight (P =
0.874). This observation leads the authors to surmise that there exists a subtle MRI signature in the adipose
tissue that the model used for classification. Furthermore, the imaging hotspots are not consistently at a
region of the largest adipose collection; thus, it is likely that the 3D-CNN model is detecting an intra-
adipose or adipose-adjacent signal. Future work could focus on using image segmentation techniques to
better quantify the exact types of tissue present within GradCAM hotspots. Finally, posterior upper thoracic
adipose tissue is typically distant from the region of pseudarthrosis, which in our cohort was predominately
in the low lumbar region. Thus, it can be surmised that the network learned a global signature of