
Page 74 - Read Online
P. 74
Page 404 Johnson et al. Art Int Surg 2024;4:401-10 https://dx.doi.org/10.20517/ais.2024.40
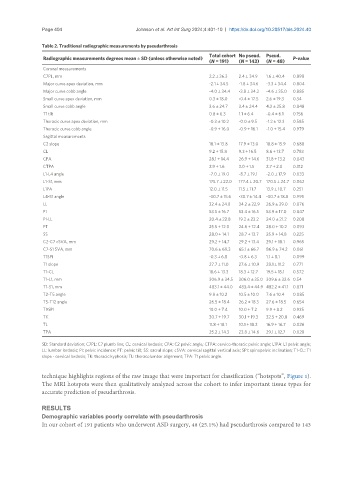
Table 2. Traditional radiographic measurements by pseudarthrosis
Total cohort No pseud. Pseud.
Radiographic measurements degrees mean ± SD (unless otherwise noted) P-value
(N = 191) (N = 143) (N = 48)
Coronal measurements
C7PL, mm 2.2 ± 36.3 2.4 ± 34.9 1.6 ± 40.4 0.898
Major curve apex deviation, mm -2.1 ± 34.5 -1.8 ± 34.6 -3.3 ± 34.4 0.804
Major curve cobb angle -4.0 ± 34.4 -3.8 ± 34.2 -4.6 ± 35.0 0.885
Small curve apex deviation, mm 0.3 ± 18.0 -0.4 ± 17.5 2.6 ± 19.3 0.34
Small curve cobb angle 3.6 ± 24.7 3.4 ± 24.4 4.2 ± 25.8 0.848
T1 tilt 0.8 ± 6.3 1.1 ± 6.4 -0.4 ± 6.1 0.156
Thoracic curve apex deviation, mm -0.3 ± 10.2 -0.0 ± 9.5 -1.2 ± 12.3 0.585
Thoracic curve cobb angle -0.9 ± 16.0 -0.9 ± 16.1 -1.0 ± 15.4 0.979
Sagittal measurements
C2 slope 18.1 ± 13.8 17.9 ± 13.0 18.8 ± 15.9 0.688
CL 9.2 ± 15.8 9.3 ± 16.5 8.6 ± 13.7 0.783
CPA 28.1 ± 14.4 26.9 ± 14.6 31.8 ± 13.2 0.043
CTPA 2.9 ± 1.6 3.0 ± 1.5 2.7 ± 2.0 0.312
L1-L4 angle -7.0 ± 19.0 -8.7 ± 19.1 -2.0 ± 17.9 0.033
L1-S1, mm 175.7 ± 22.0 177.4 ± 20.7 170.5 ± 24.7 0.062
L1PA 12.0 ± 11.5 11.5 ± 11.7 13.9 ± 10.7 0.251
L4-S1 angle -30.7 ± 15.6 -30.7 ± 14.4 -30.7 ± 18.8 0.995
LL 32.4 ± 24.8 34.2 ± 22.9 26.9 ± 29.0 0.076
PI 53.5 ± 16.7 53.4 ± 16.5 53.9 ± 17.0 0.847
PI-LL 20.4 ± 22.8 19.2 ± 23.2 24.0 ± 21.2 0.208
PT 25.5 ± 12.0 24.6 ± 12.4 28.0 ± 10.2 0.093
SS 28.0 ± 14.1 28.7 ± 13.7 25.9 ± 14.8 0.225
C2-C7 cSVA, mm 29.2 ± 14.7 29.2 ± 13.4 29.1 ± 18.1 0.965
C7-S1 SVA, mm 70.6 ± 69.3 65.1 ± 66.7 86.9 ± 74.2 0.061
T1SPI -0.3 ± 6.8 -0.8 ± 6.3 1.1 ± 8.1 0.099
T1 slope 27.7 ± 11.0 27.6 ± 10.9 28.1 ± 11.2 0.771
T1-CL 18.6 ± 13.3 18.3 ± 12.7 19.5 ± 15.1 0.572
T1-L1, mm 306.9 ± 34.5 306.0 ± 35.0 309.6 ± 32.6 0.54
T1-S1, mm 483.1 ± 44.0 483.4 ± 44.9 482.2 ± 41.1 0.871
T2-T5 angle 9.8 ± 10.2 10.5 ± 10.0 7.6 ± 10.4 0.085
T5-T12 angle 26.5 ± 18.4 26.2 ± 18.3 27.6 ± 18.5 0.654
T9SPI 10.0 ± 7.4 10.0 ± 7.2 9.9 ± 8.2 0.925
TK 30.7 ± 19.7 30.1 ± 19.3 32.5 ± 20.8 0.469
TL 11.8 ± 18.1 10.1 ± 18.3 16.9 ± 16.7 0.026
TPA 25.2 ± 14.3 23.8 ± 14.6 29.1 ± 12.7 0.028
SD: Standard deviation; C7PL: C7 plumb line; CL: cervical lordosis; CPA: C2 pelvic angle; CTPA: cervico-thoracic pelvic angle; L1PA: L1 pelvic angle;
LL: lumbar lordosis; PI: pelvic incidence; PT: pelvic tilt; SS: sacral slope; cSVA: cervical sagittal vertical axis; SPI: spinopelvic inclination; T1-CL: T1
slope - cervical lordosis; TK: thoracic kyphosis; TL: thoracolumbar alignment; TPA: T1 pelvic angle.
technique highlights regions of the raw image that were important for classification (“hotspots”, Figure 1).
The MRI hotspots were then qualitatively analyzed across the cohort to infer important tissue types for
accurate prediction of pseudarthrosis.
RESULTS
Demographic variables poorly correlate with pseudarthrosis
In our cohort of 191 patients who underwent ASD surgery, 48 (25.1%) had pseudarthrosis compared to 143